
Patreon
Thanks to our new Patreon supporters!
Kyle
Paxton Irving
Patrick Chase
Robert Angerer
Willow Cheney
Chris Cramer
Paul Nawashar
Video
There is also a video that presents the same information:
Knife Steel Tests and Ratings
I have tested many knife steels over the past several years and reported the results in many articles. I also have an article where I created ratings for each steel based on those past experiments. In that article I spent quite a bit of space on what is behind the properties of each steel. For example, I showed an equation I developed that predicts the CATRA edge retention of different steels based on carbide types, carbide volume, steel hardness, and the edge angle of the blade. I wanted to try to demystify the ratings a bit to show that steel results are somewhat predictable based on certain factors. Of course there are always many counter-examples where we test a steel and are surprised by a result, usually in the negative direction. With enough investigation it is possible to find out why a result was different than the expectation, though of course we don’t always have the resources to do that.
So in an ideal world we would have experimental data for each steel and don’t have to speculate on how good the steel might be. Before I started doing my testing there was very little 3rd party data available for comparing steels between companies. So Crucible or Uddeholm, etc. might compare the general properties between their own steels but generally not between their steels and the competitors’. And the companies rarely have data for everything about a steel, many data sheets are missing wear resistance or toughness experimental results, etc. But can the average knife enthusiast look at a steel composition and make a reasonable estimate of its properties? Can it be done just by looking at one or two elements and then checking with a chart? (As opposed to complicated equations). I decided to see if such a thing could be possible. I will also point out some of the cases where the estimates break down and why.
This might be my worst idea ever, as now my comments will be filled with people asking about every possible outlier in the predictions. At least you will be better at predicting steel properties than AI.
Compositions
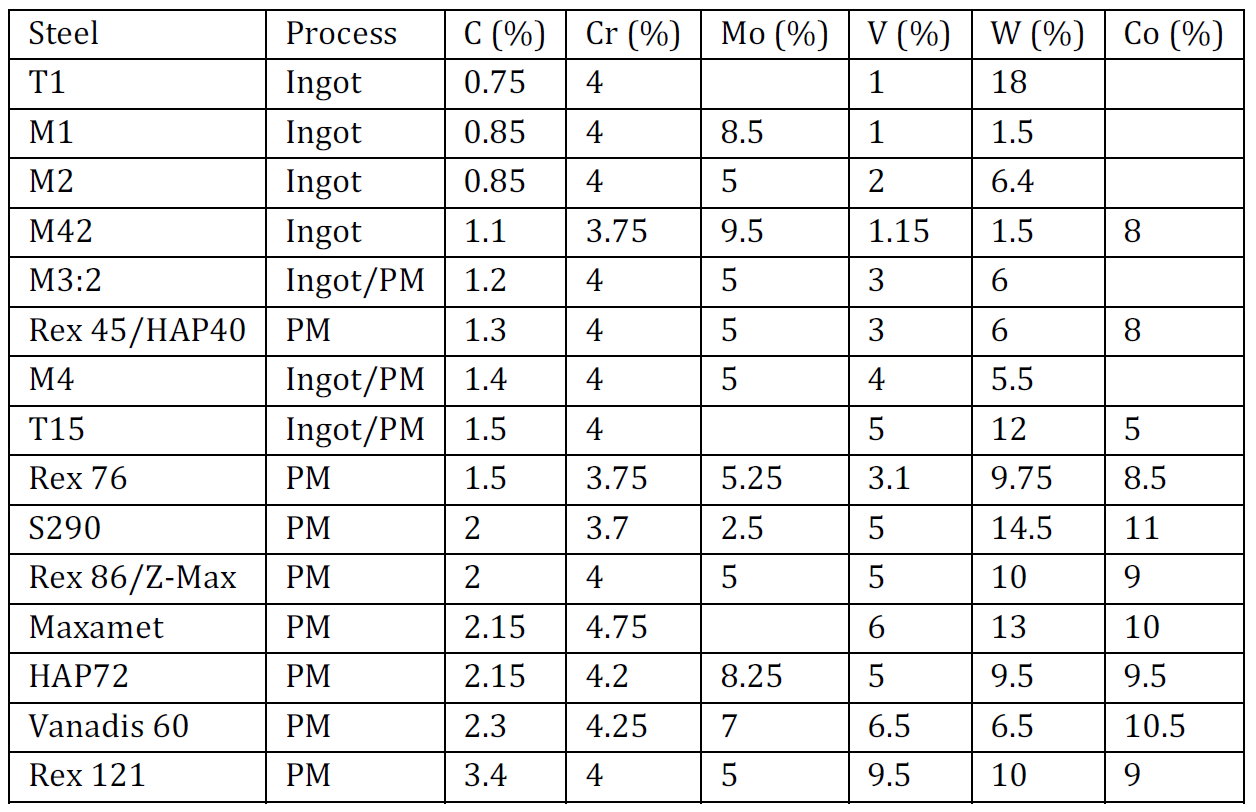
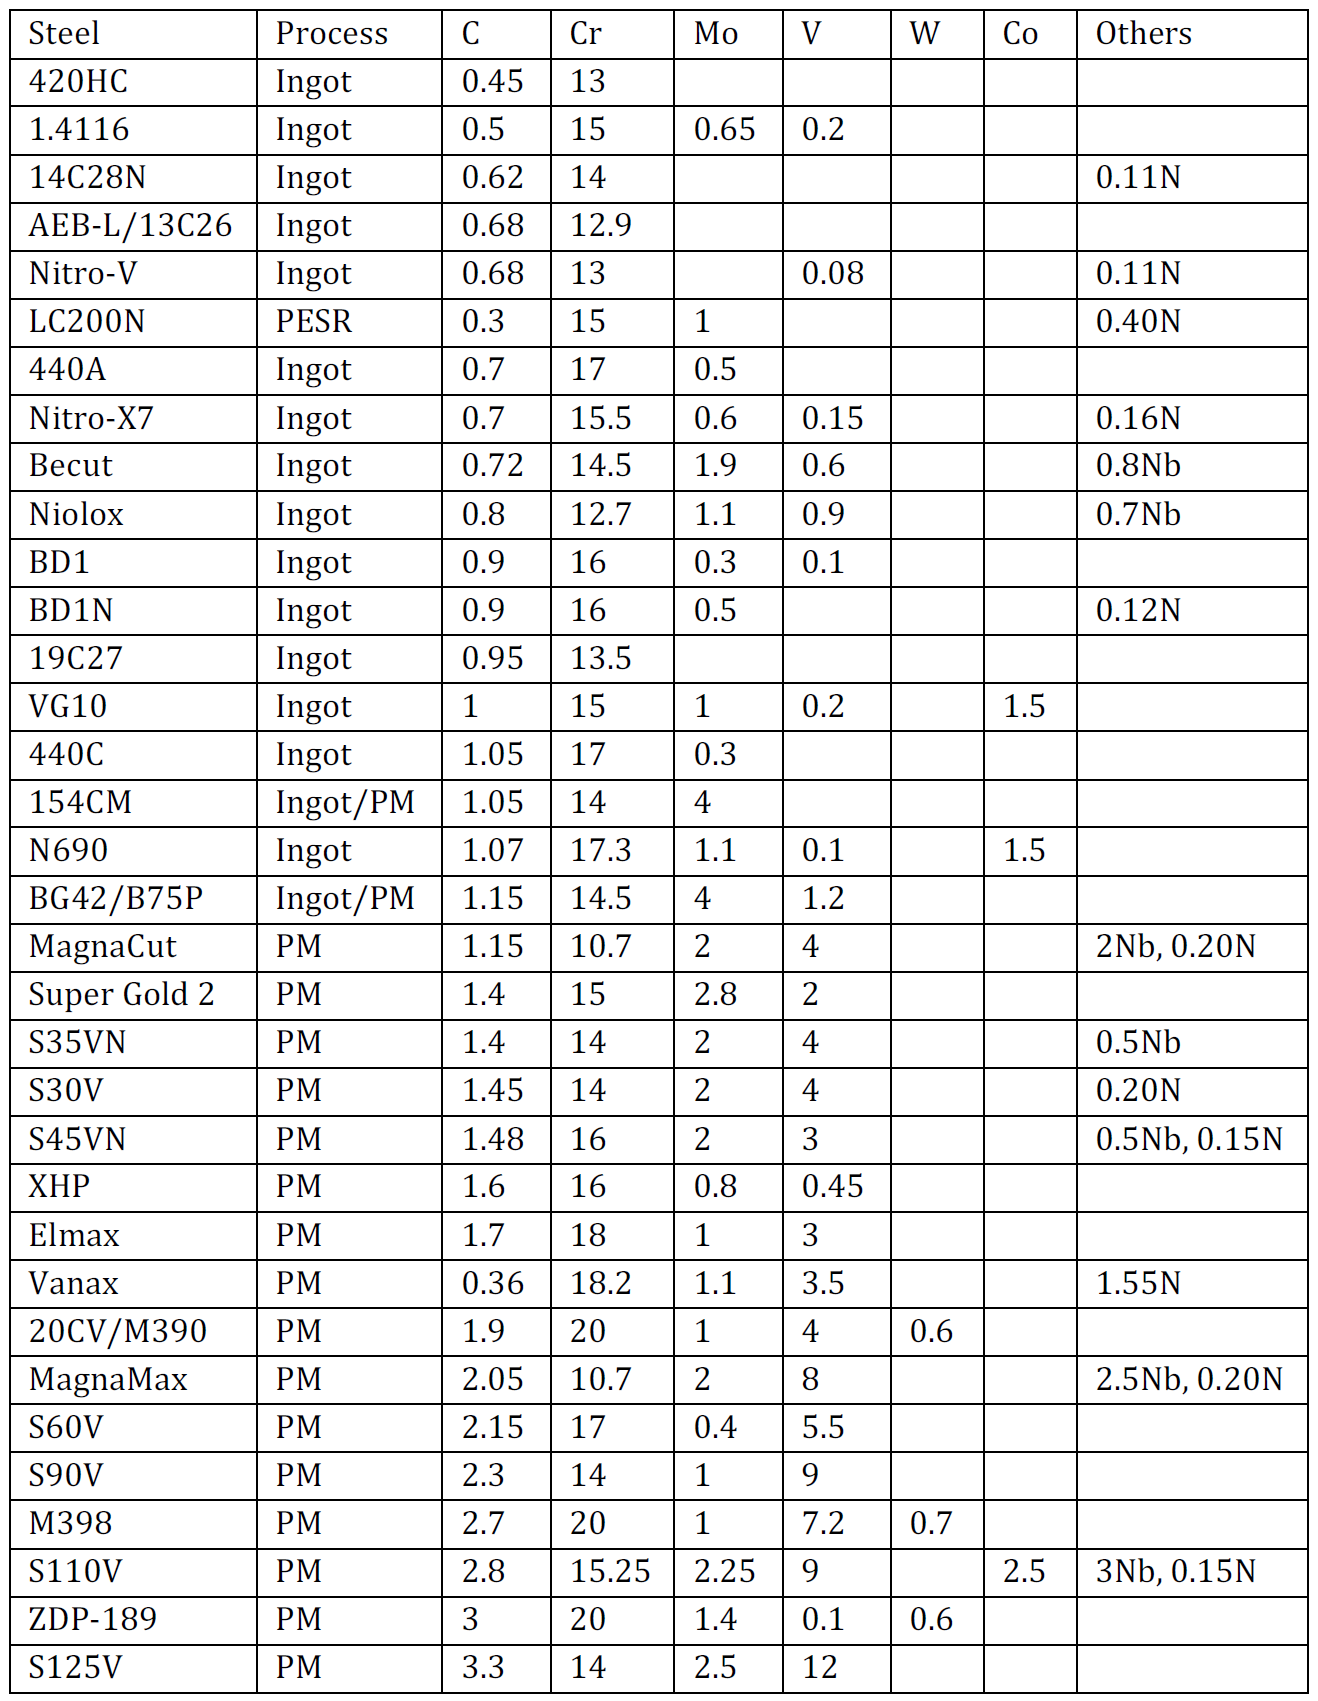
So for these predictions, I am trying to find the best correlations I can using only the published elemental composition of each steel. These are available in many places, such as the steel manufacturer websites, in articles on my website, in Knife Engineering 2nd edition, or Zknives.com has a huge database of them. For the high alloy steels, it also lists whether it is “ingot” (conventional steelmaking) or PM (powder metallurgy), which will be relevant for the toughness predictions.
Carbon Steels
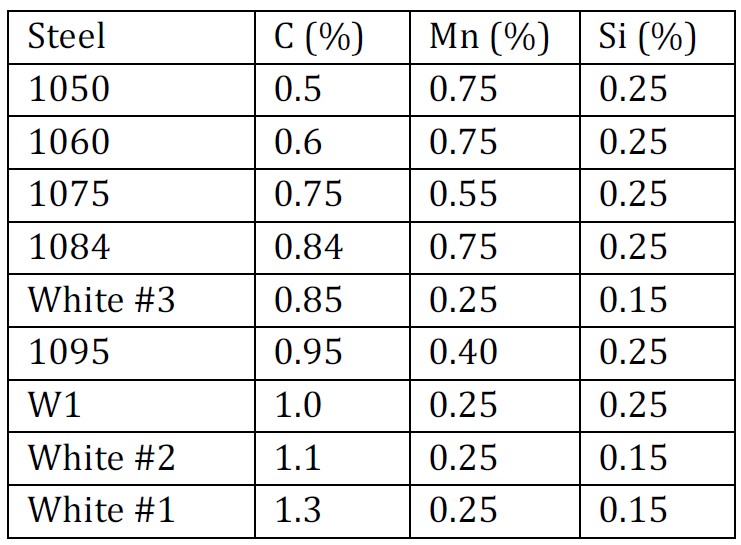
Low Alloy Steels
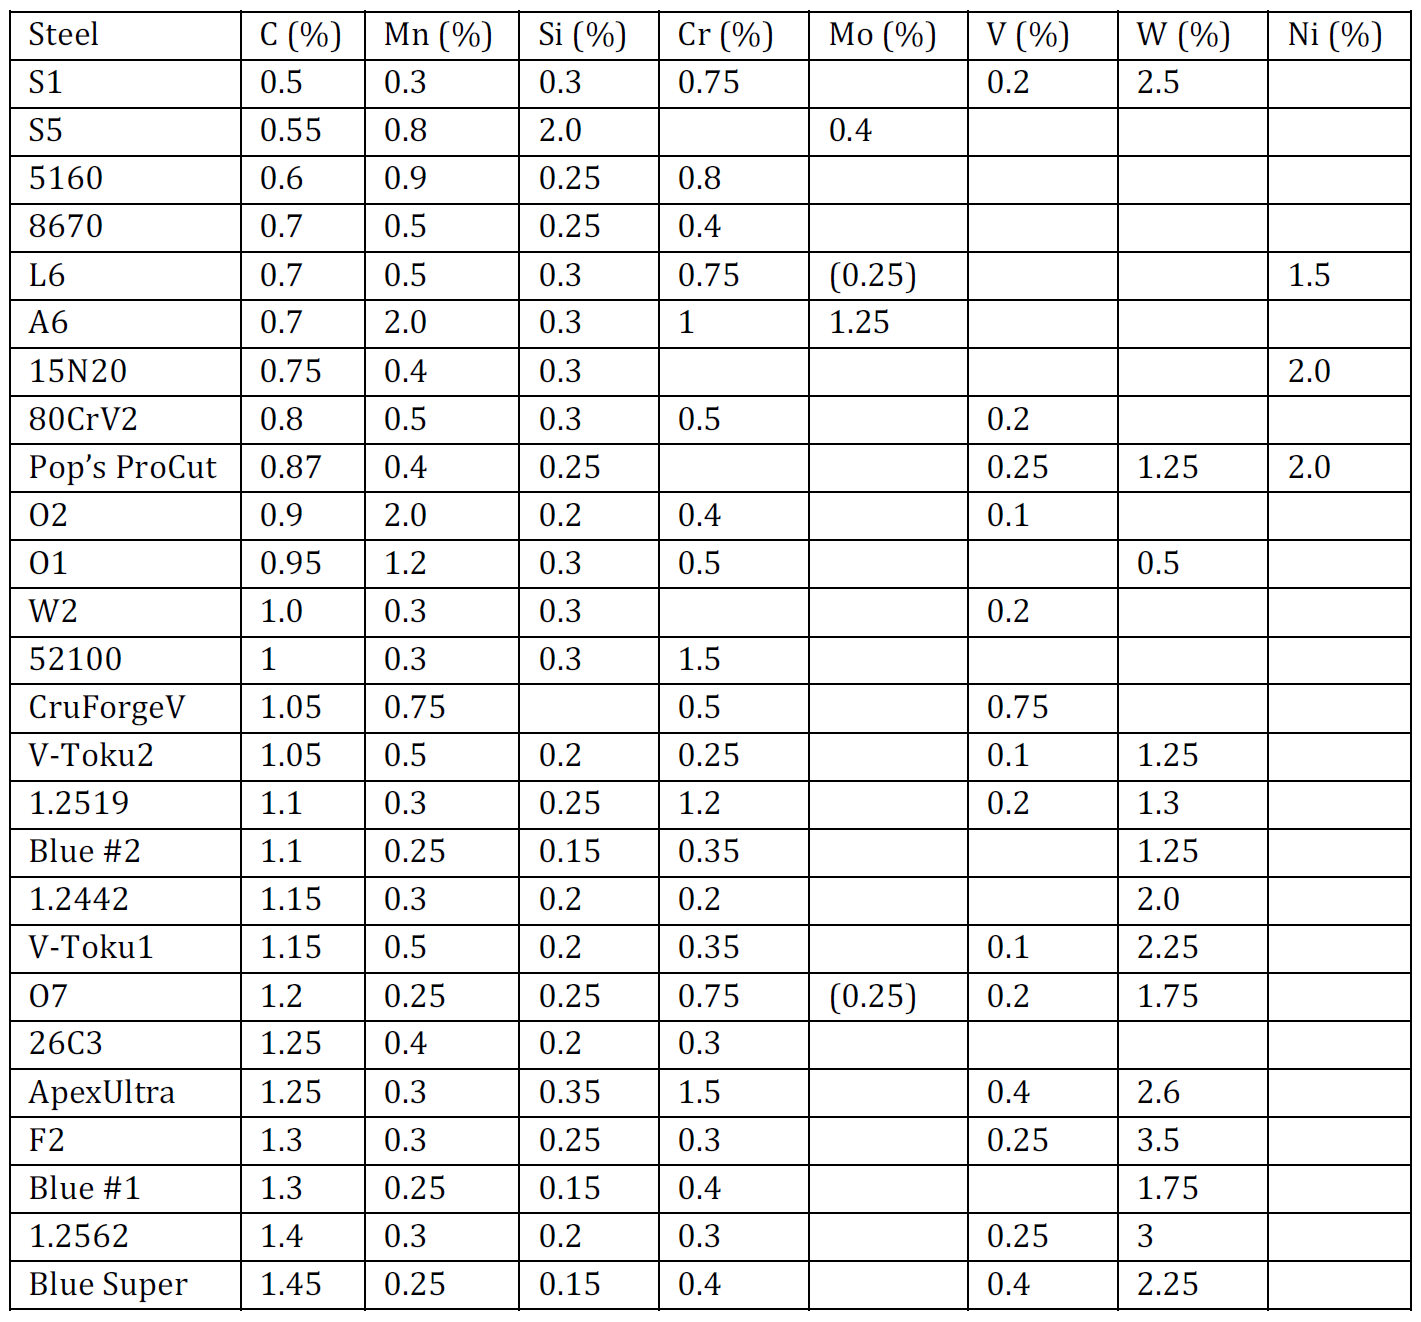
High Alloy Steels
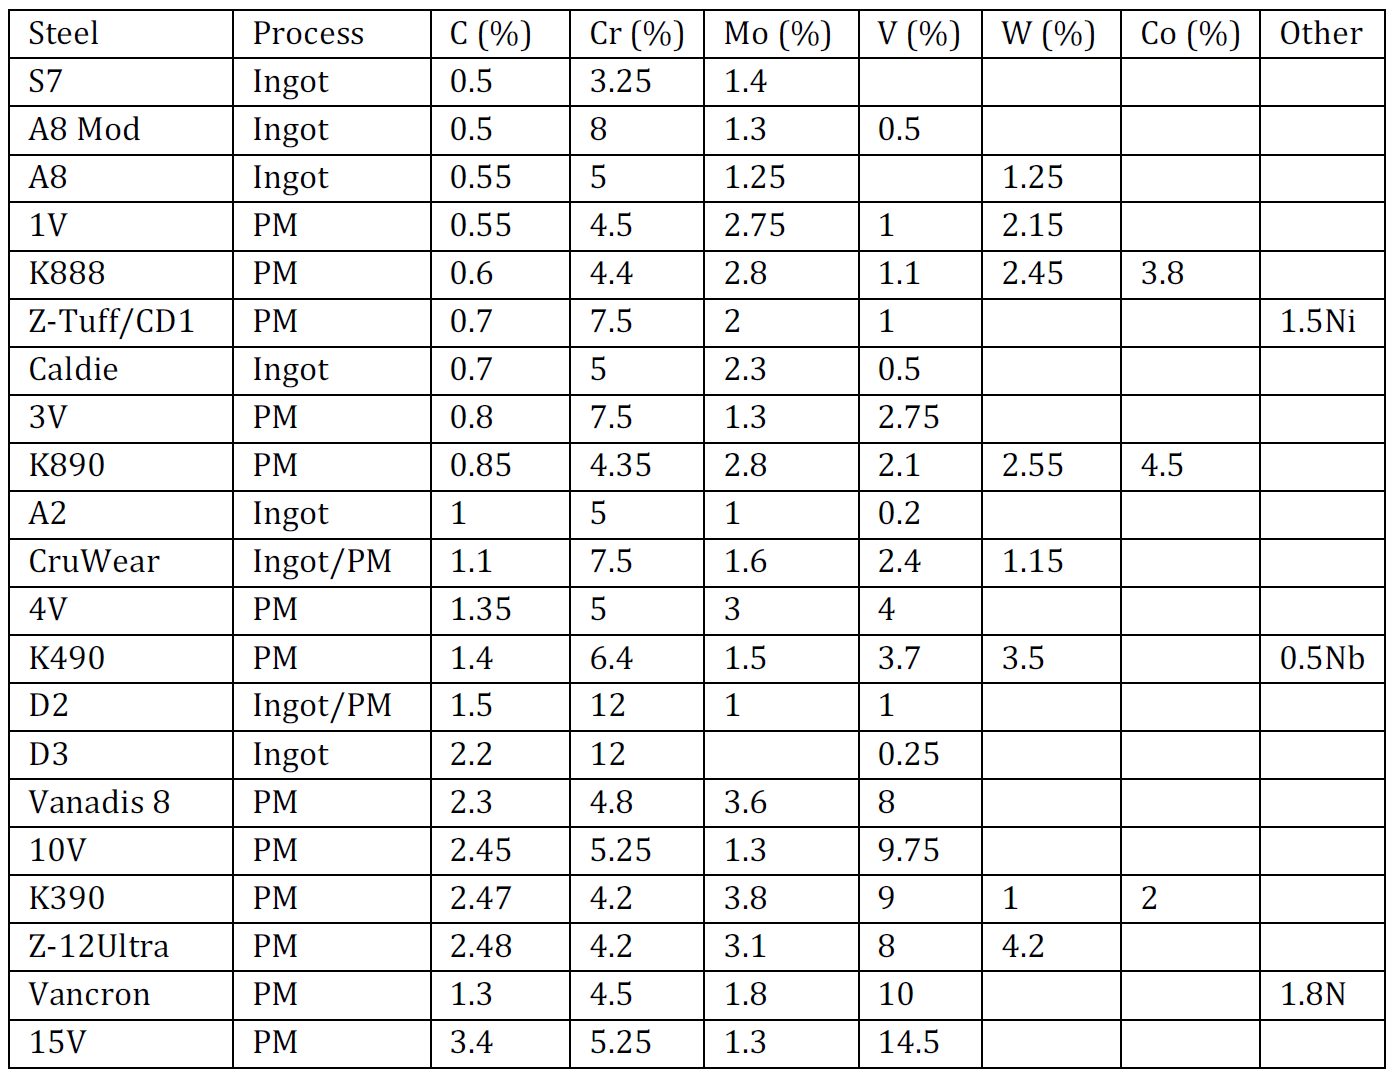
High Speed Steels
Stainless Steels
Edge Retention
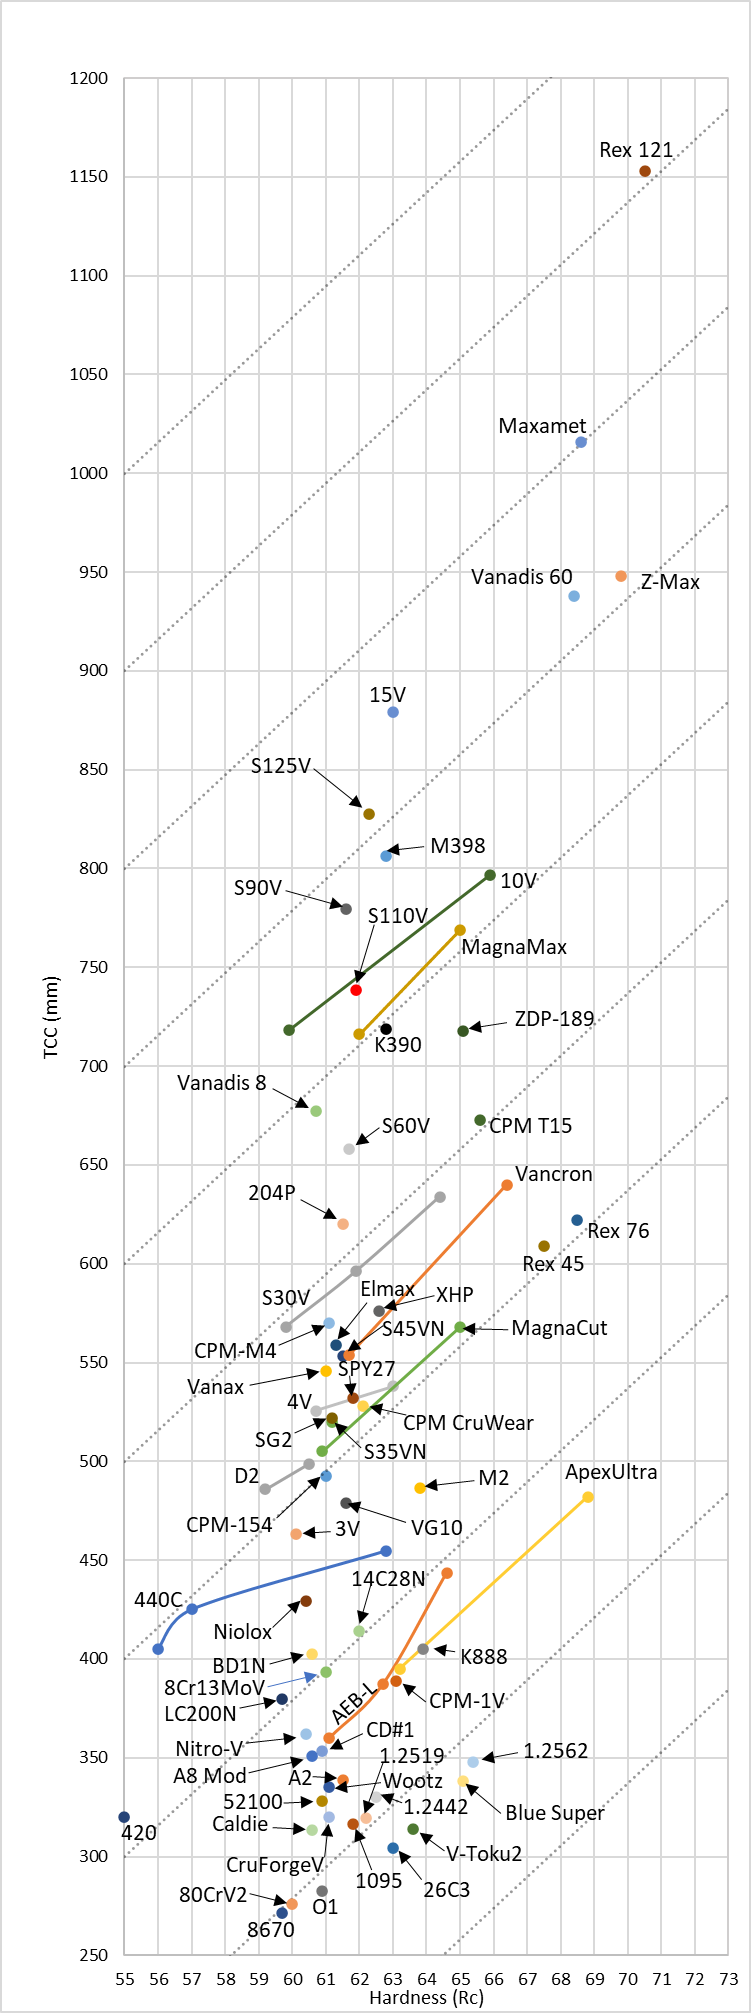
Edge retention seems to be the favorite property of knife enthusiasts so we will start there. I have a big article on CATRA edge retention here that discusses a lot of the individual grades and why they land where they do.
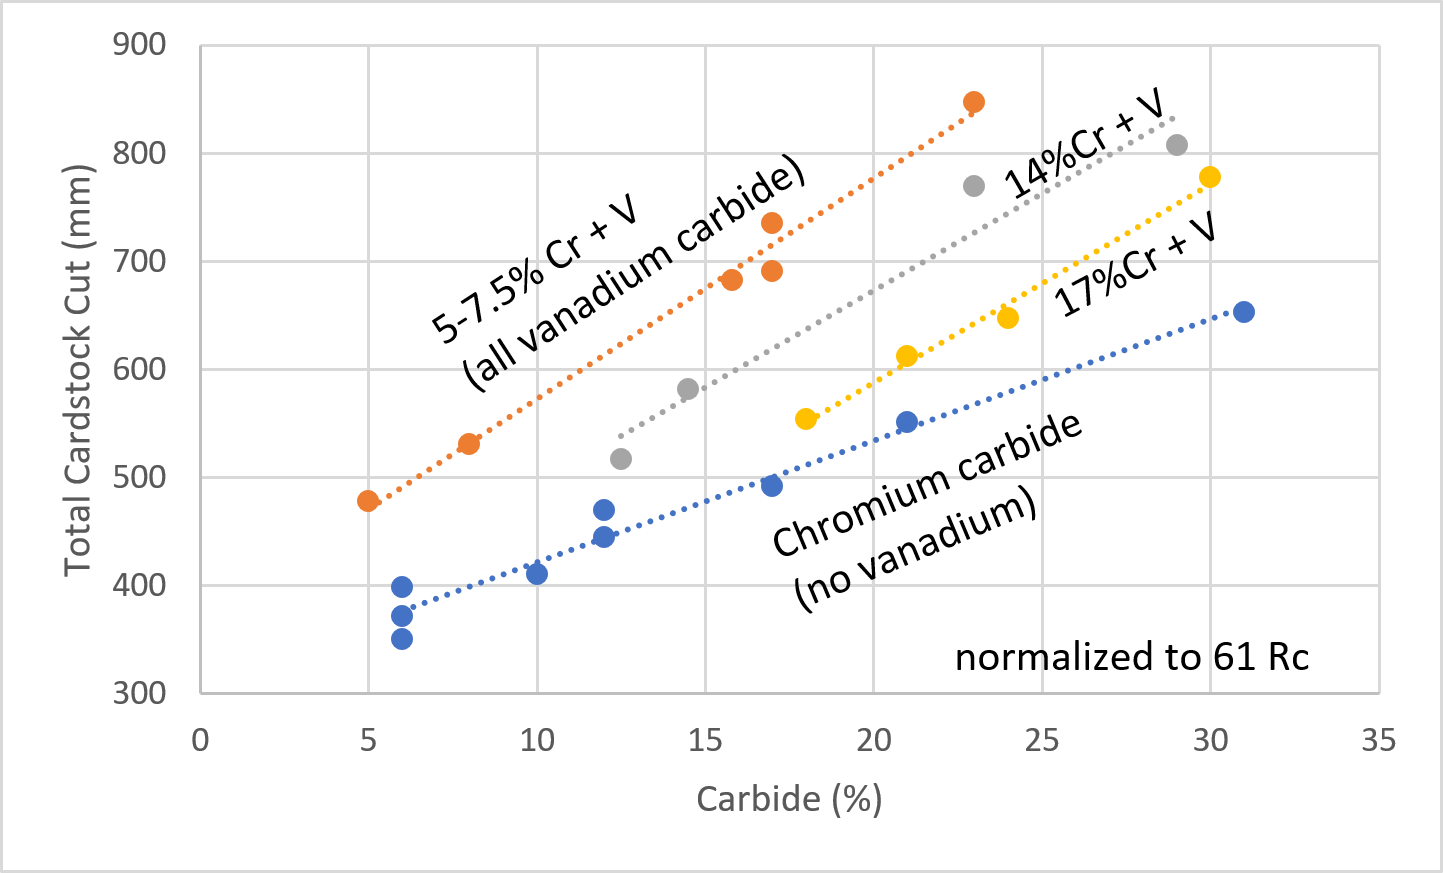
One thing I showed was a chart comparing some different stainless and non-stainless steels to each other and the overall amount of carbide to show that more carbide leads to higher wear resistance and edge retention:
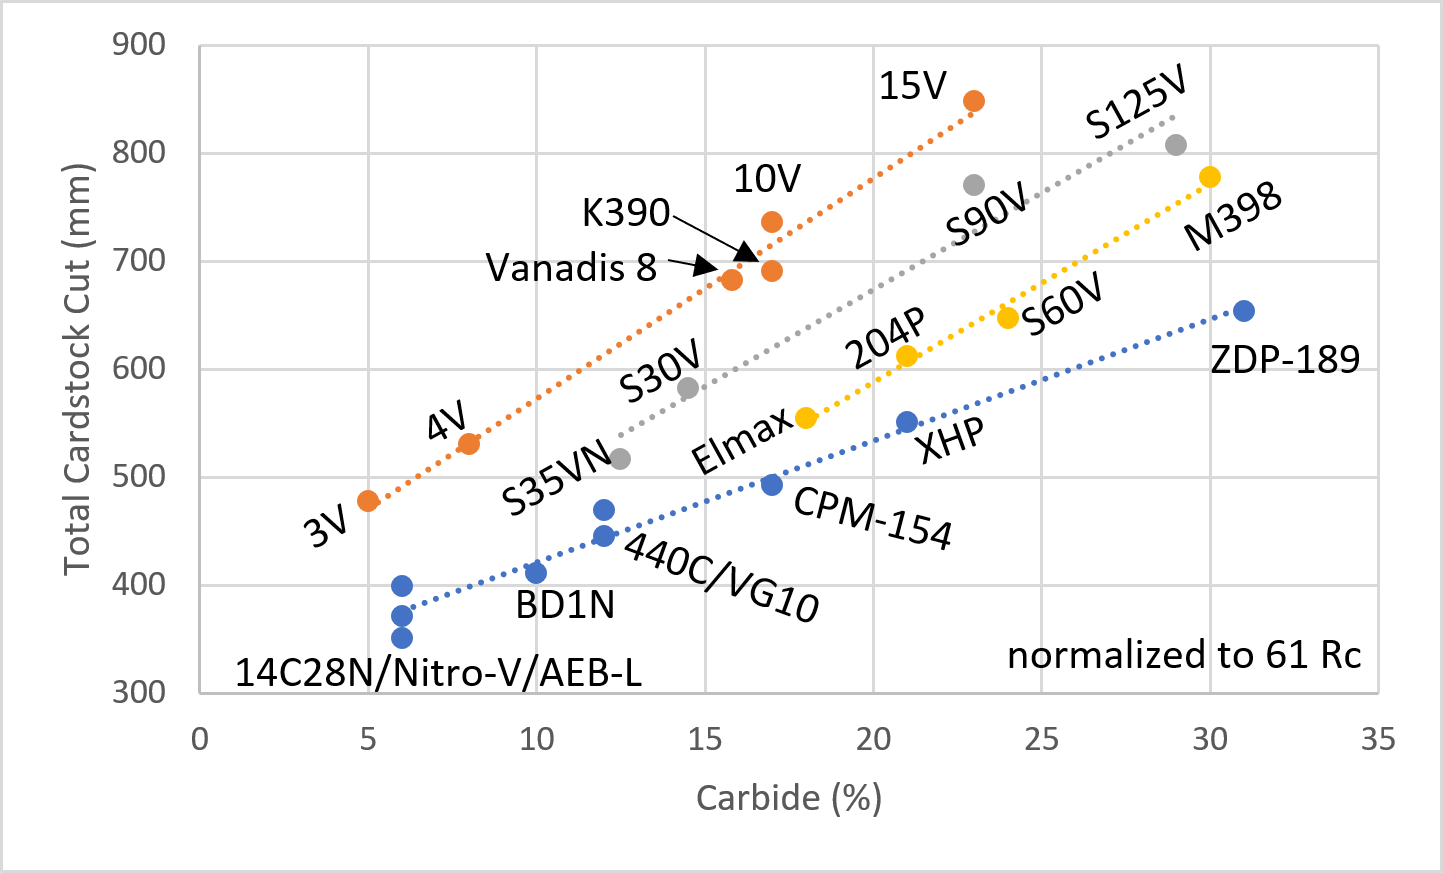
Those different color dots correspond to different amounts of chromium and vanadium because those are important factors for edge retention:
You can see micrographs of the steels to get an idea of the increase in carbide volume:
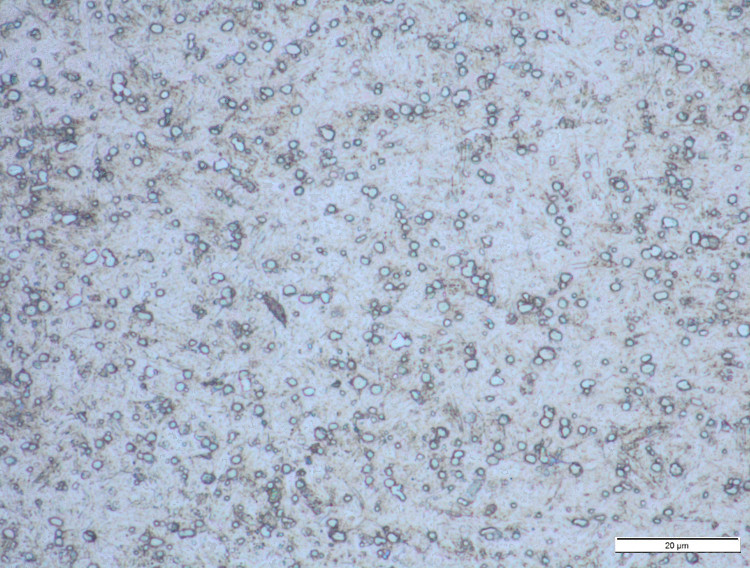
CPM-3V
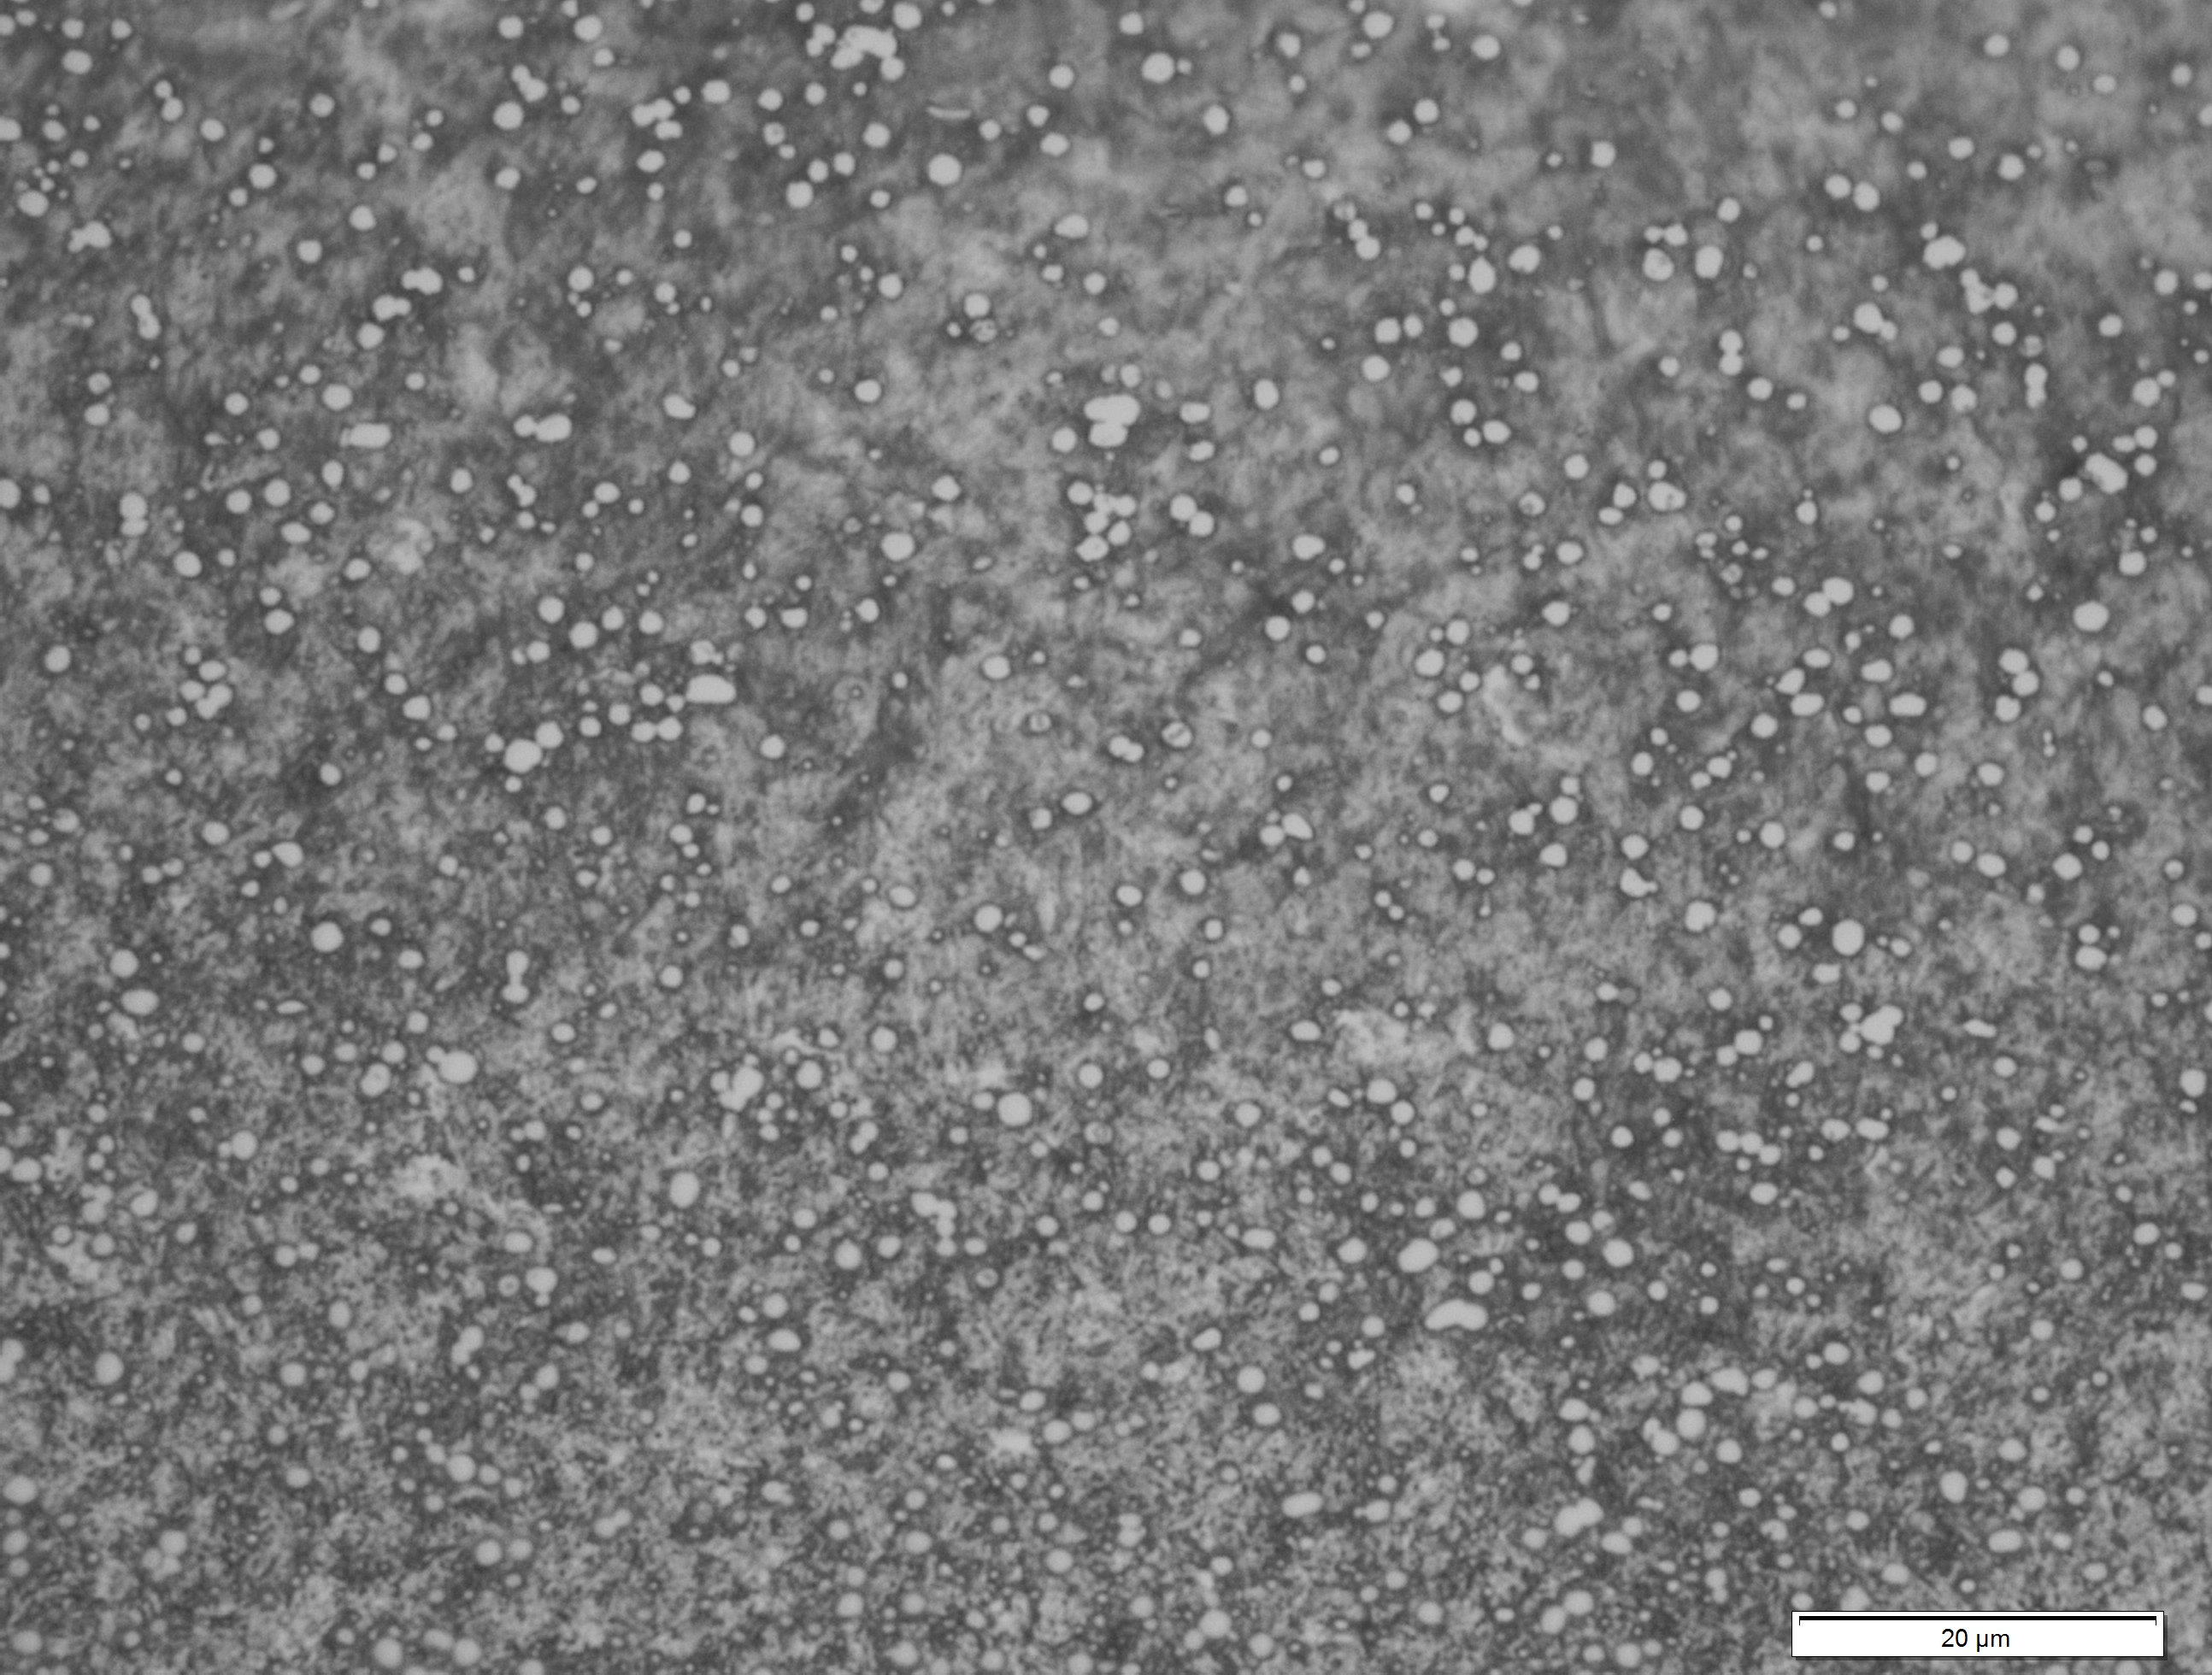
CPM-4V
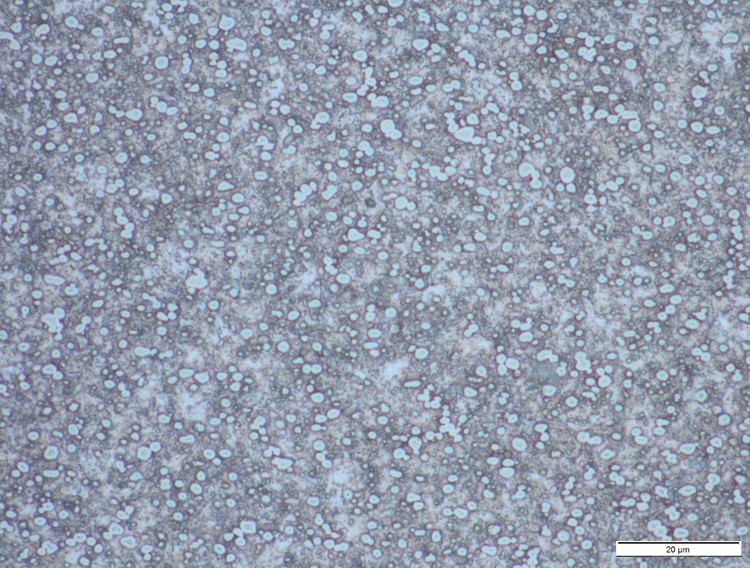
CPM-10V
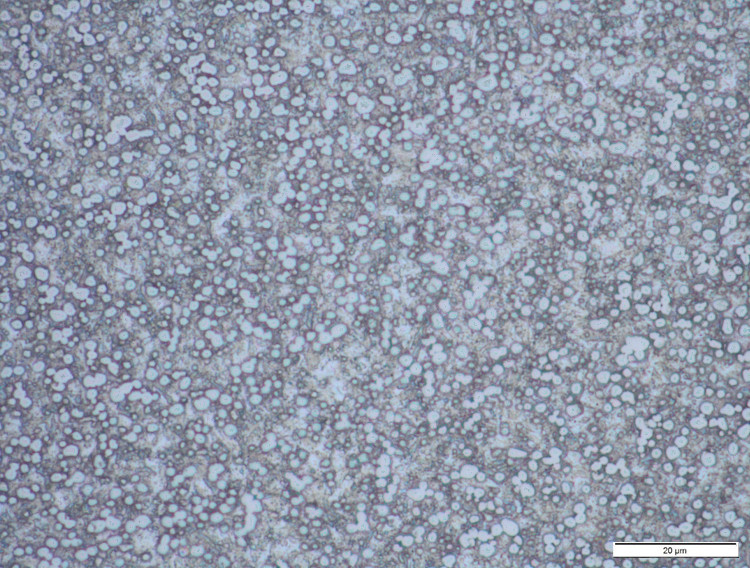
CPM-15V
The steels with low chromium (5-7.5%) and vanadium additions form a very hard vanadium carbide, and because of the high hardness of those carbides they have a stronger effect on edge retention for a given carbide volume. Chromium carbides are significantly softer and so you need a lot more carbide to achieve the same level of wear resistance. Increasing amounts of chromium in the steel reduces the amount of vanadium carbide formed for a given amount of vanadium, and replaces it with the softer chromium carbides. However, because the total carbide volume is generally higher for those grades, the edge retention is actually pretty consistent for a given amount of vanadium:
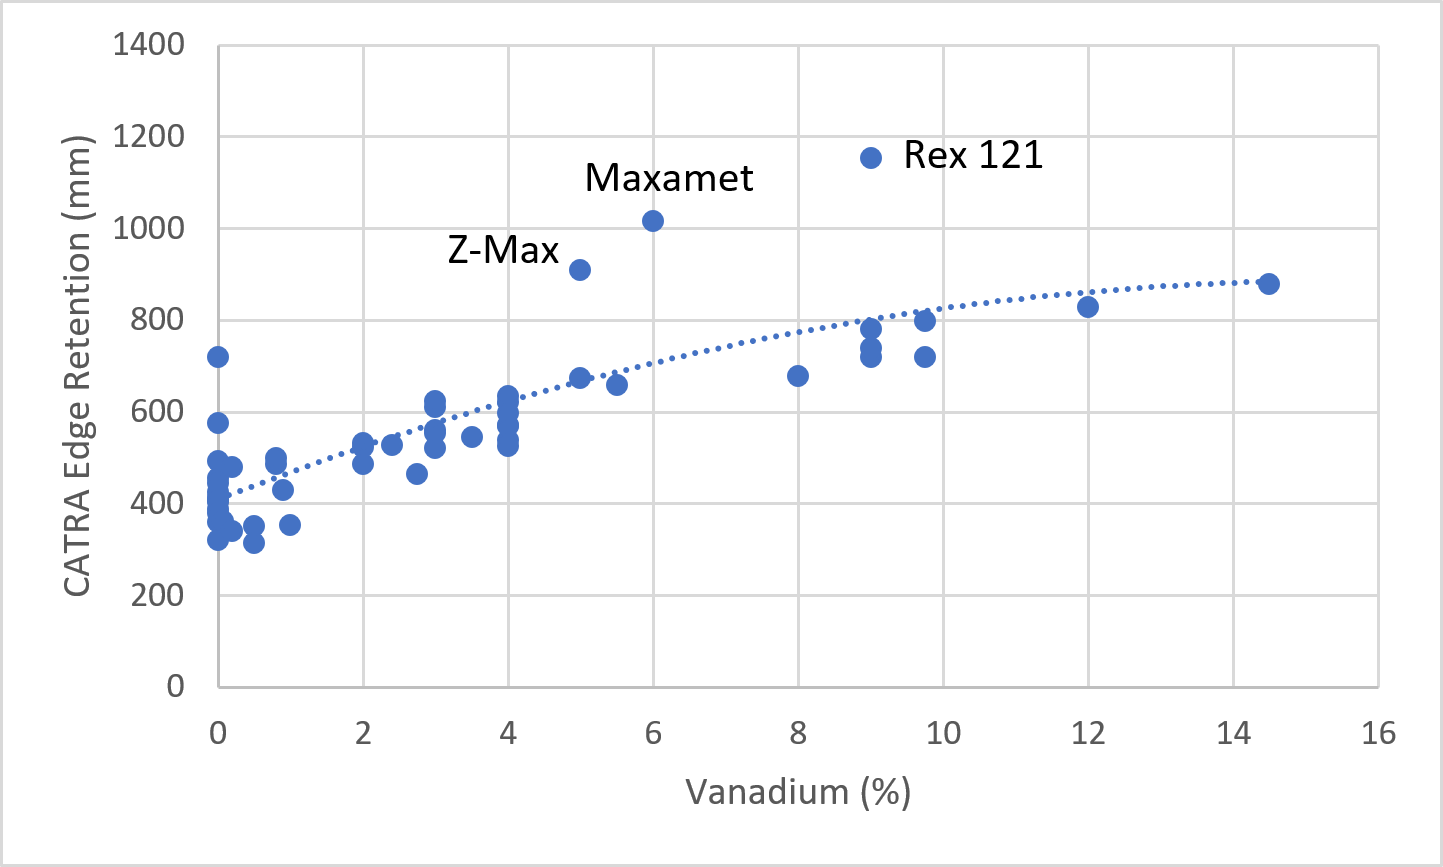
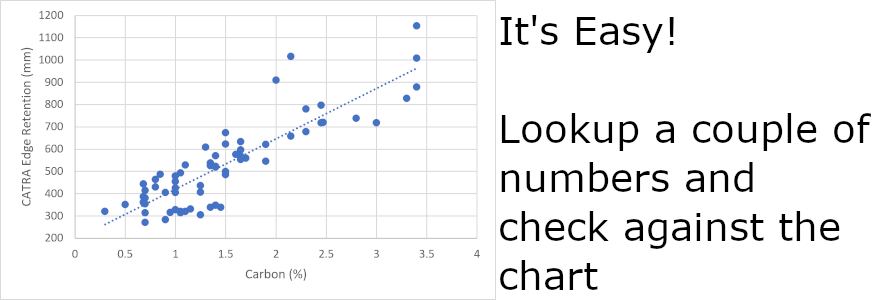
However, this is not perfect of course. Most of the steels I “normalized” to a hardness of 61 HRC so we are comparing the steels and not the steel and hardness at the same time. The effect of hardness on CATRA edge retention is relatively predictable if you look at the angled grey dashed lines on the CATRA chart. Z-Max, Maxamet, and Rex 121 are above the line for the other steels because they have a lot of tungsten/molybdenum carbide in them and also because they were tested at very high hardness levels and aren’t really designed to be used at lower hardness. So I didn’t normalize them to 61 HRC. Also when you look at the 0% vanadium region it ranges all the way from 300 to 750 mm or so. This is because there are steels with little or no vanadium that can have a lot of chromium carbide and still have relatively high wear resistance. Those steels still need high carbon to form all of those carbides, however, which also includes those extreme high speed steels like Rex 121. So I found that carbon was actually the simplest predictor of edge retention:
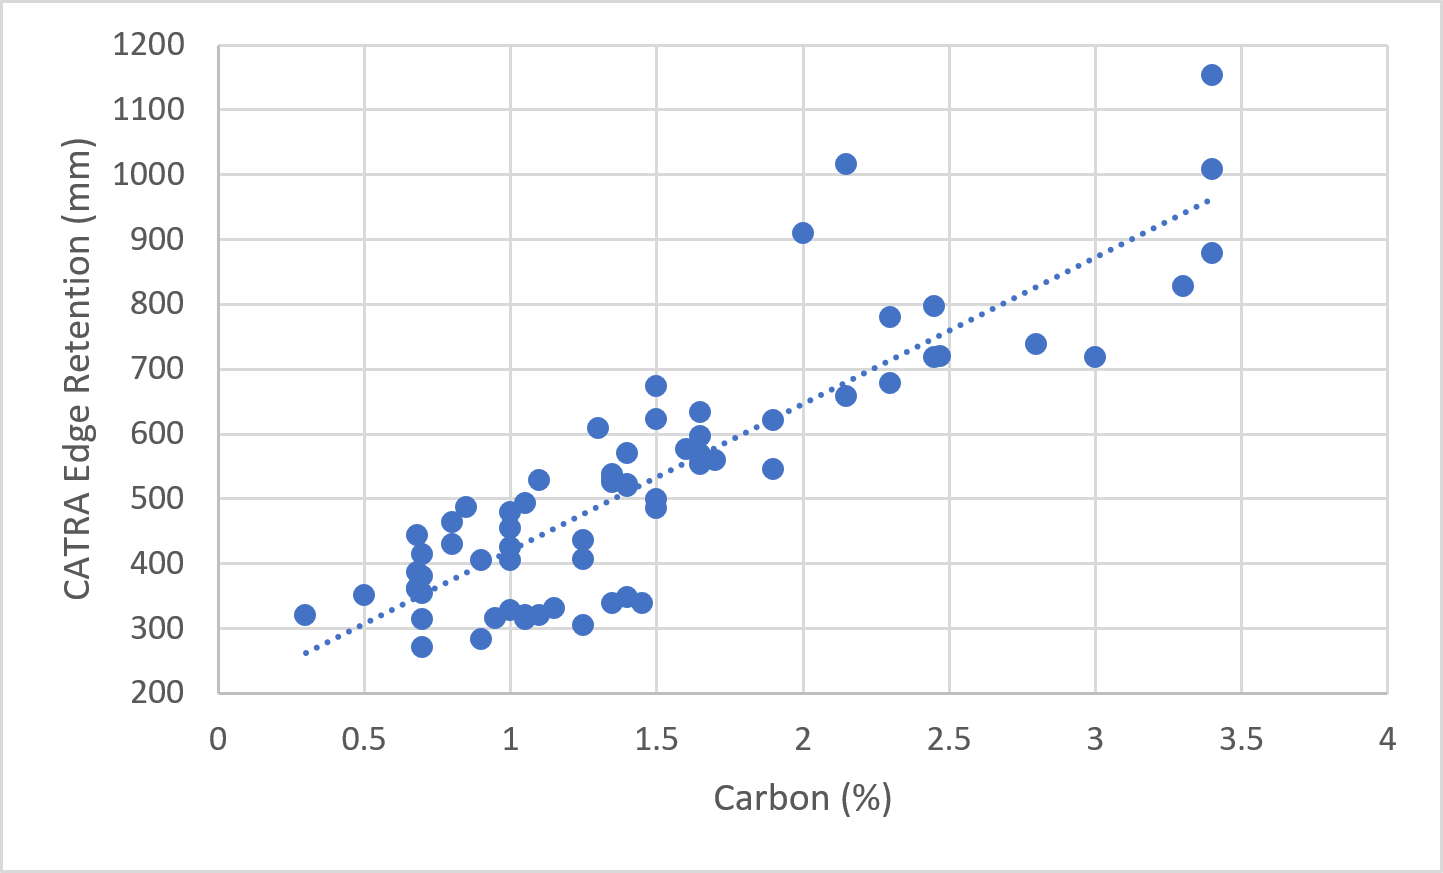
There are still some steels that are relatively low compared to others, such as the cluster of steels in the 300 mm range at 1-1.5% carbon. Those are low alloy steels with very soft iron carbides called cementite. So I broke out the steels into different categories and the predictions get even better:
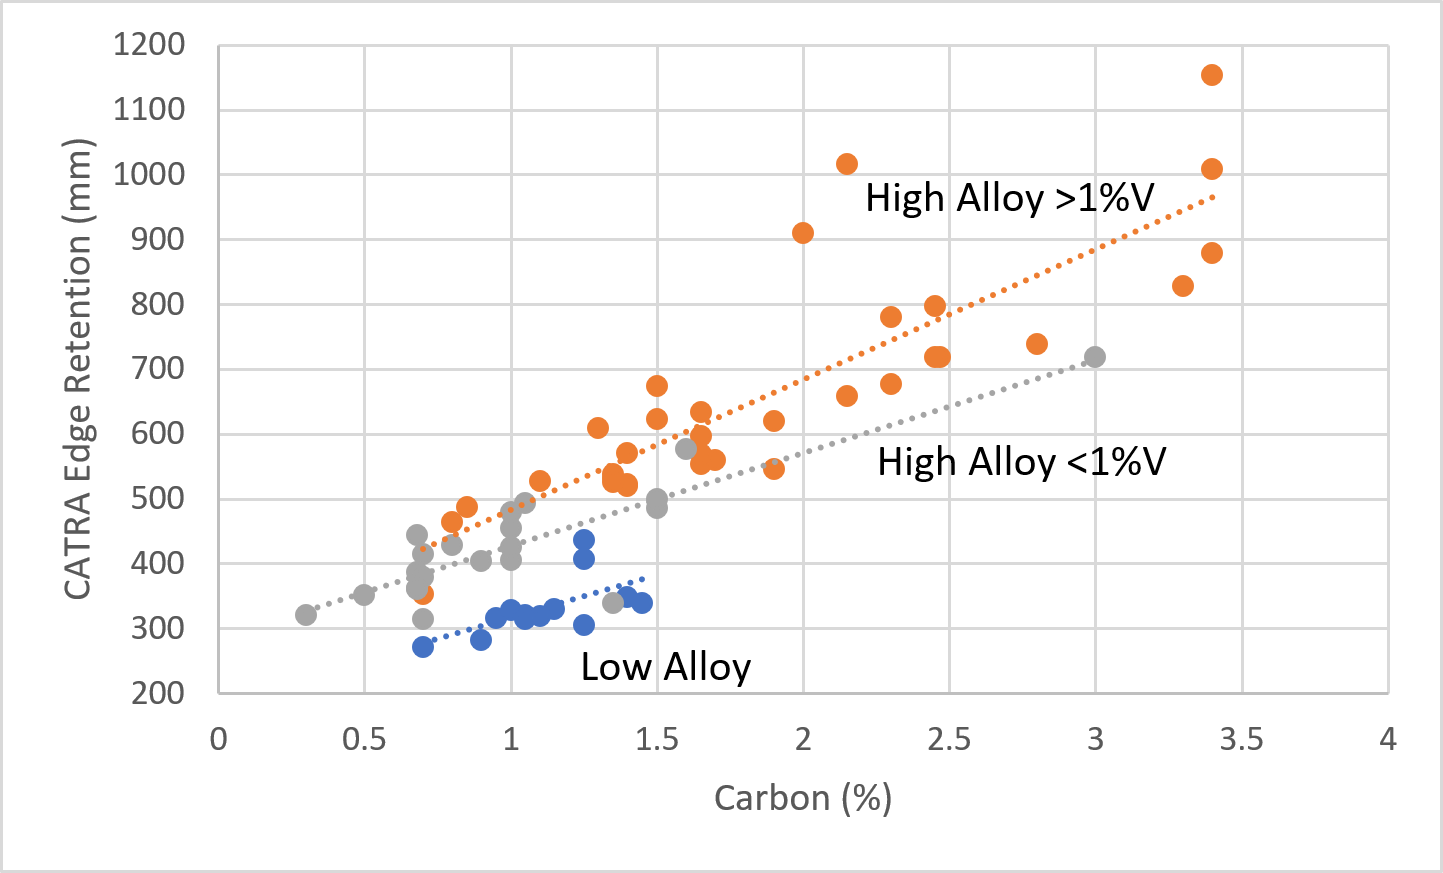
So to get an estimate of edge retention based on composition you follow this process:
- Does the steel have less than 3% Cr? If yes it is a “low alloy” steel, otherwise it is a “high alloy steel.”
- Does the steel have a significant vanadium addition? If so look at the “High Alloy >1%V” line, otherwise look at the grey line.
Nothing is perfect of course but that can give you an idea of where the properties might land. Note that it is not separated by stainless vs carbon steel, all of the stainless steels are within the “high alloy” category in this case. Could also probably break out steels designed to be used at over 66 HRC but this is close enough for our purposes I think. This does not factor in nitrogen since there are very few steels with which to build an estimate. Nitrogen could probably be added to the carbon, or perhaps use 6/7 multiplied by nitrogen because of the atomic weight difference.
Toughness
Toughness is also greatly controlled by steel hardness and carbide volume. However, the carbide hardness matters a lot less for toughness, and instead it is the carbide size that is very important in this case, which we didn’t discuss at all for edge retention. One of the big differentiators here is the technology used to make the steel. The most expensive knife steels are made with powder metallurgy, which leads to a smaller carbide size. So you can get higher toughness for a given amount of carbide. One example would be D2 steel made with conventional steelmaking, powder metallurgy, or an in-between technology called sprayform. You can see the difference in carbide size and toughness below:
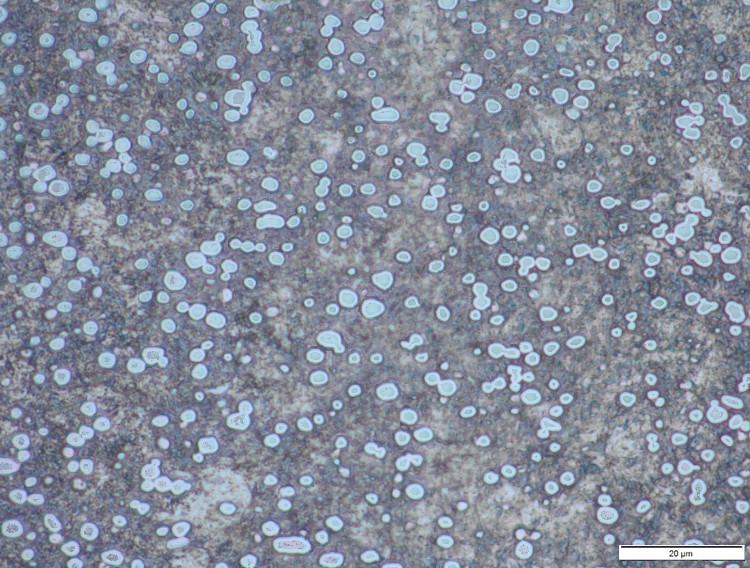
CPM-D2 (powder metallurgy)
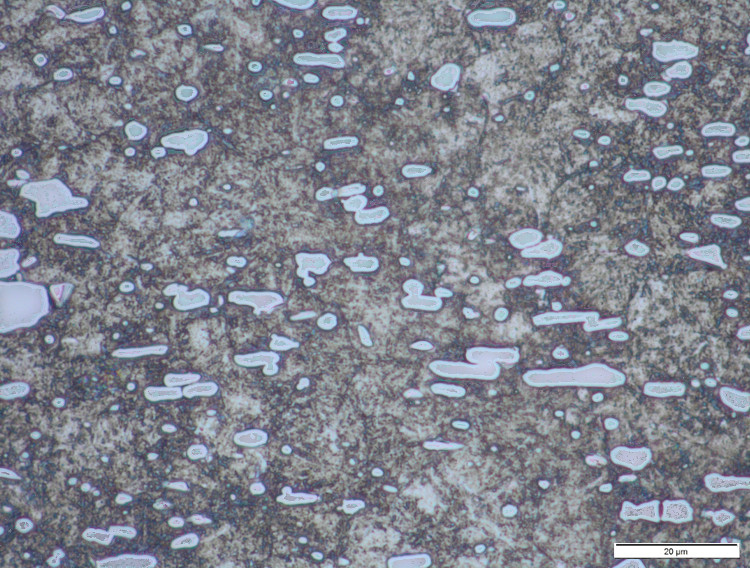
PSF27 (sprayform D2)
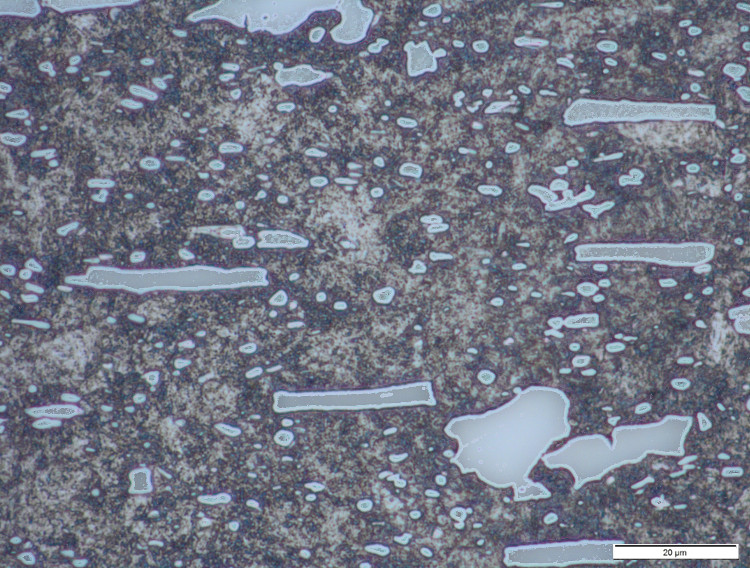
D2 (conventional steelmaking)
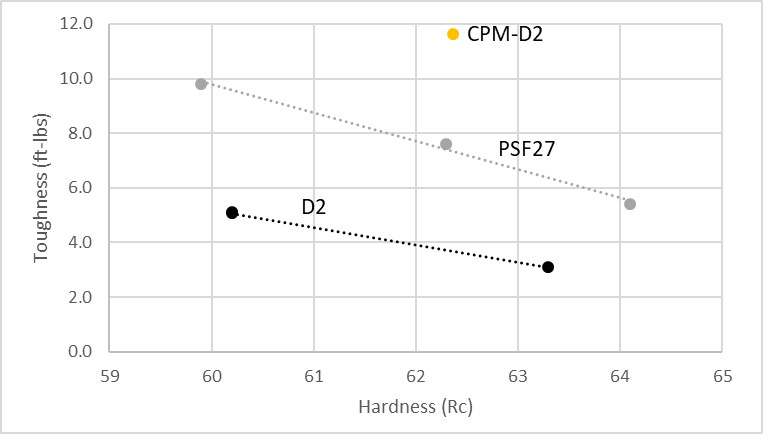
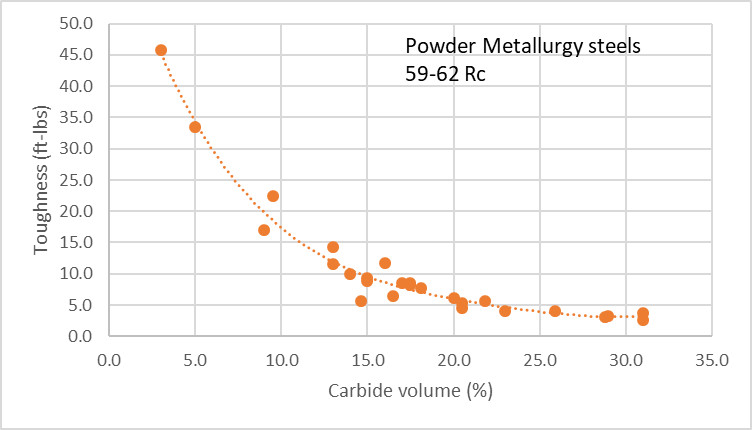
The amount of carbide matters just as much as the size as the carbides, however. More carbide reduces toughness because they are very hard particles, and are the sites where cracks will initiate and grow. Here is a chart showing powder metallurgy steels and the strong correlation with toughness and carbide volume:
However, we do not know what the carbide volume is just based on the composition, so we need some other factor for estimating. The closest we have is again looking at the carbon content, since you need more carbon to form more carbide:
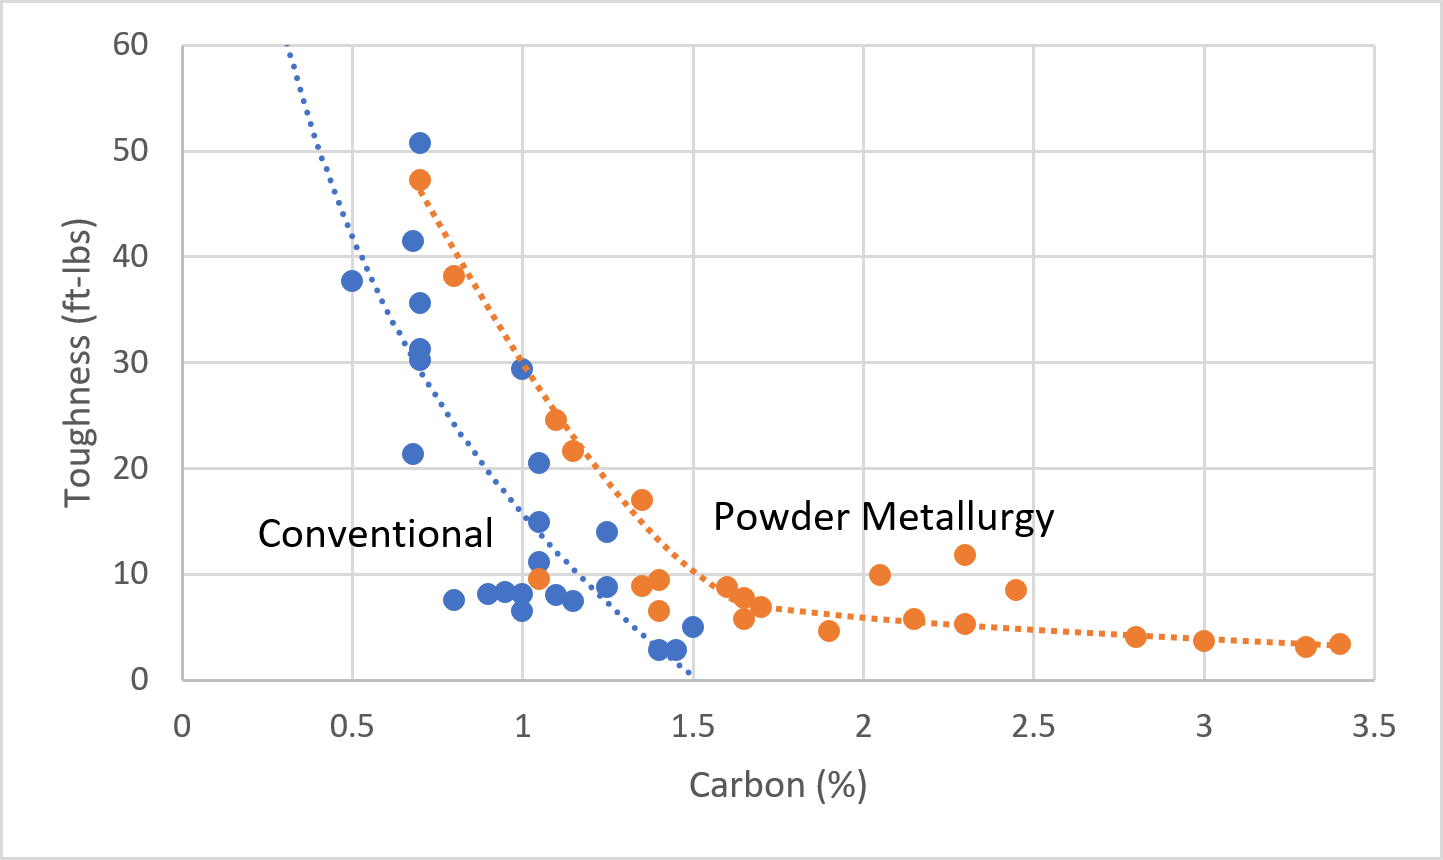
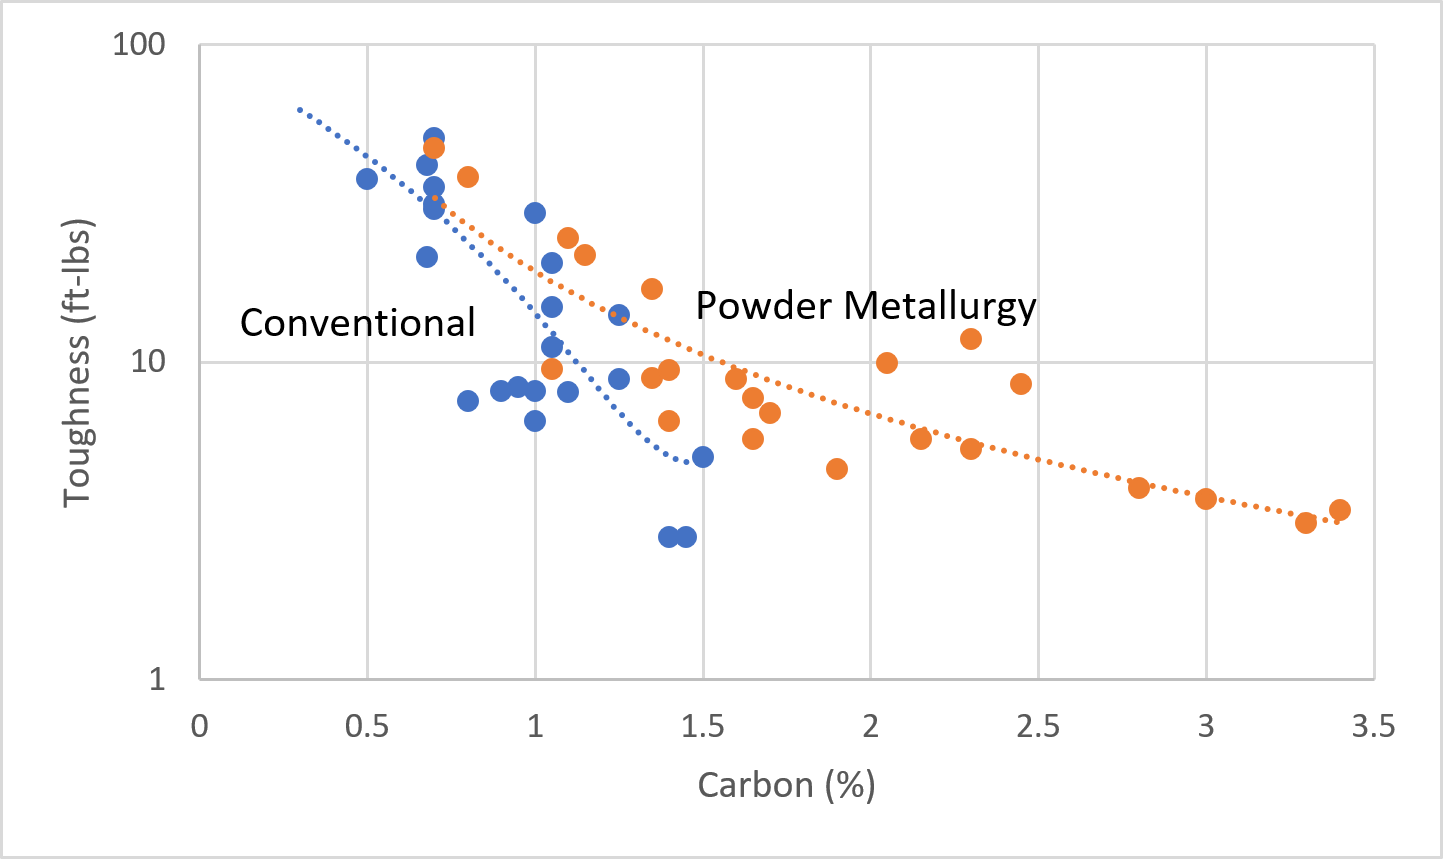
So that gives us a reasonably good estimate of toughness though not perfect of course. While you can see that toughness drops relatively rapidly up to 1.5% carbon this can be somewhat misleading. In terms of expected performance, toughness behaves more on a log scale. Plotting it that way shows the following:
As an example of how even a relatively low carbon steel can end up with poor toughness look at 1.4116, which is a stainless steel with 0.5% C,15% Cr, and a small amount of Mo and V. With the low carbon content we would predict a relatively high toughness value. However, it only tested about 8 ft-lbs even though it was only 57 HRC. When analyzing the microstructure I found there were some very large carbides. These large carbides will of course limit the toughness. It is likely possible with better processing to reduce or eliminate these large carbides, but poor processing can turn a good steel into a bad steel.
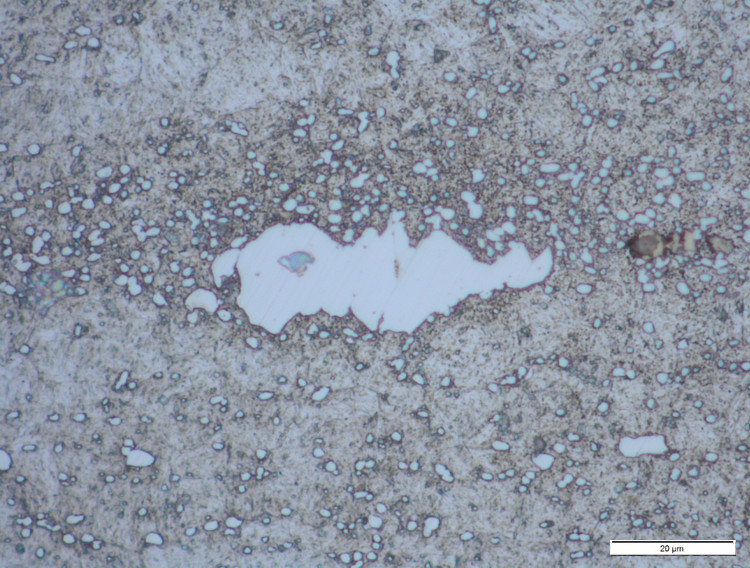
A large carbide I found in 1.4116 stainless steel
I tried to break it down further so the spread for each carbon content is smaller though it does start to get messy:
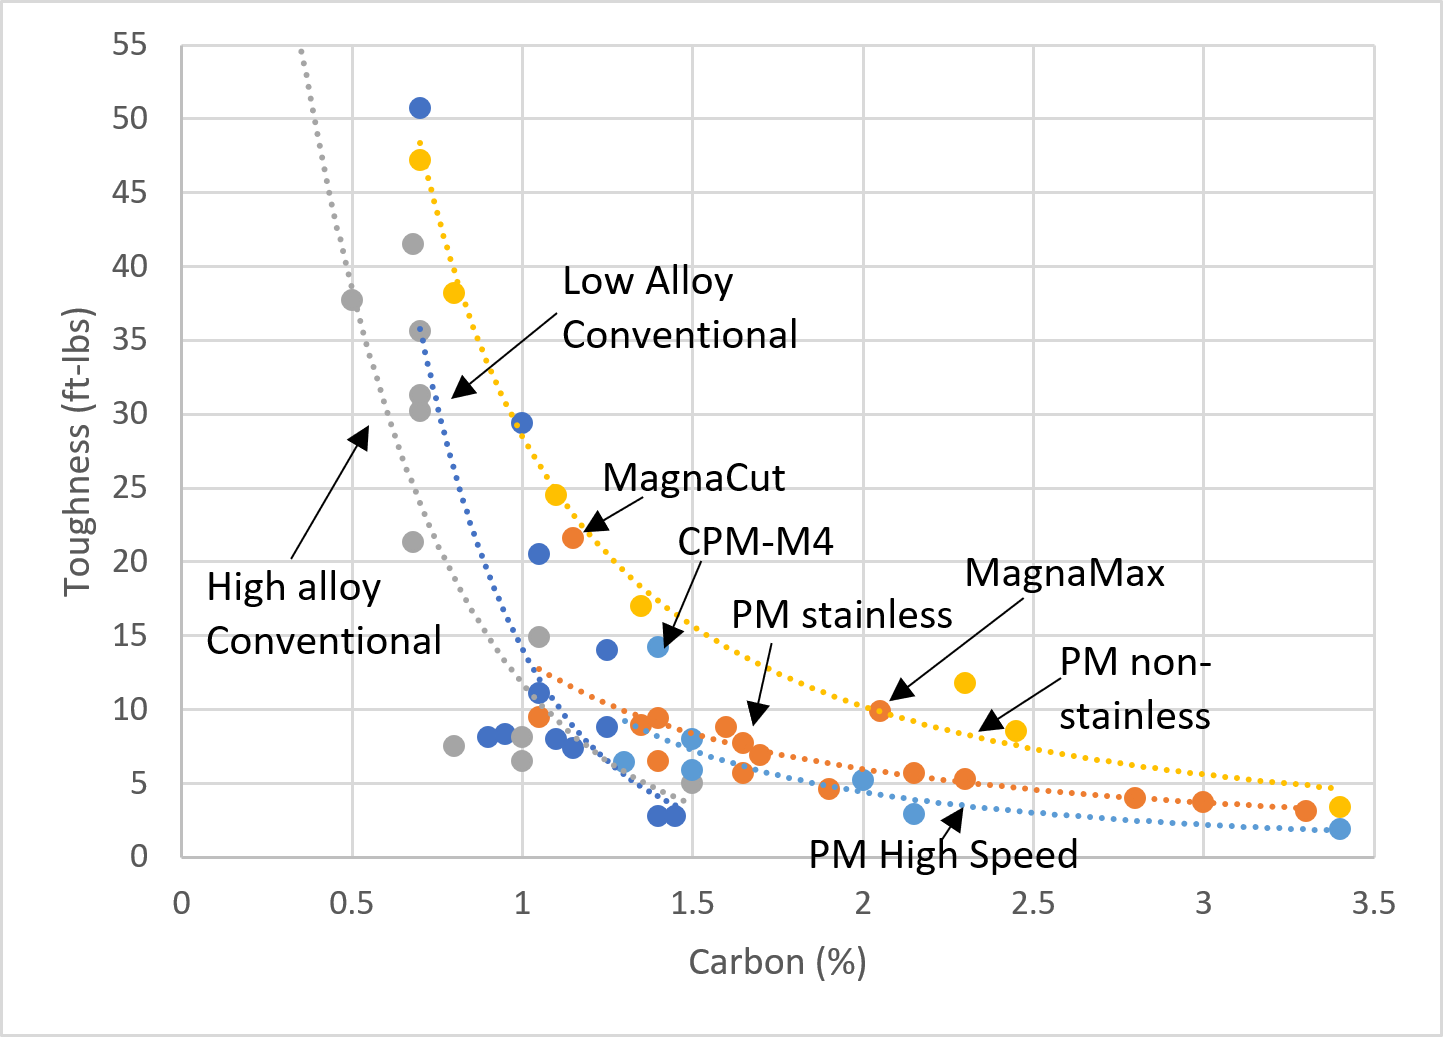
The conventional steels, whether high or low alloy are relatively close to powder metallurgy below about 1% carbon but rapidly drop. The high alloy steels see this steep drop because the carbide size becomes more and more difficult to control as the carbide volume increases. Low alloy steels have significantly less carbide for a given amount of carbon but they have more issues with “plate martensite” above about 0.85% carbon. You can read more in this article about forging knife steels. The biggest counterexample is 52100 which is the blue dot at 1% carbon and ~30 ft-lbs. The 1.5% Cr makes it less prone to having plate martensite.
The highest points on the chart are the yellow ones which are the powder metallurgy non-stainless steels. Both PM high speed (light blue) and PM stainless steels (orange) are significantly below. The reason is that the stainless steels have a significant amount of chromium carbide, and in powder metallurgy steels the chromium carbides are significantly larger than the vanadium carbides. The amount of carbide for a given carbon content is also generally higher, probably because the high chromium leads to more overall carbide. The high speed steels instead have significantly amounts of tungsten/molybdenum carbides which are also larger than vanadium carbides. Counterexamples for the above are MagnaCut, MagnaMax, and CPM-M4. MagnaCut and MagnaMax were designed to not have chromium carbides, so they behave more similarly to the non-stainless steels. CPM-M4 has less tungsten/molybdenum carbide than most other high speed steels, and is overall more balanced than other high speed steels.
Corrosion Resistance
I have a previous article about corrosion resistance testing and the factors that lead to high corrosion resistance. I also wrote about corrosion resistance and tested a bunch of steels for the MagnaCut article. Of course one of the most basic aspects of a stainless steel is having at least 10.5% Cr. However, the chromium content alone does not tell you the corrosion resistance because not all of that chromium will go towards the corrosion resistance but instead will end up as chromium carbides (which are detrimental to corrosion resistance). But the correlation is still pretty good with bulk chromium:
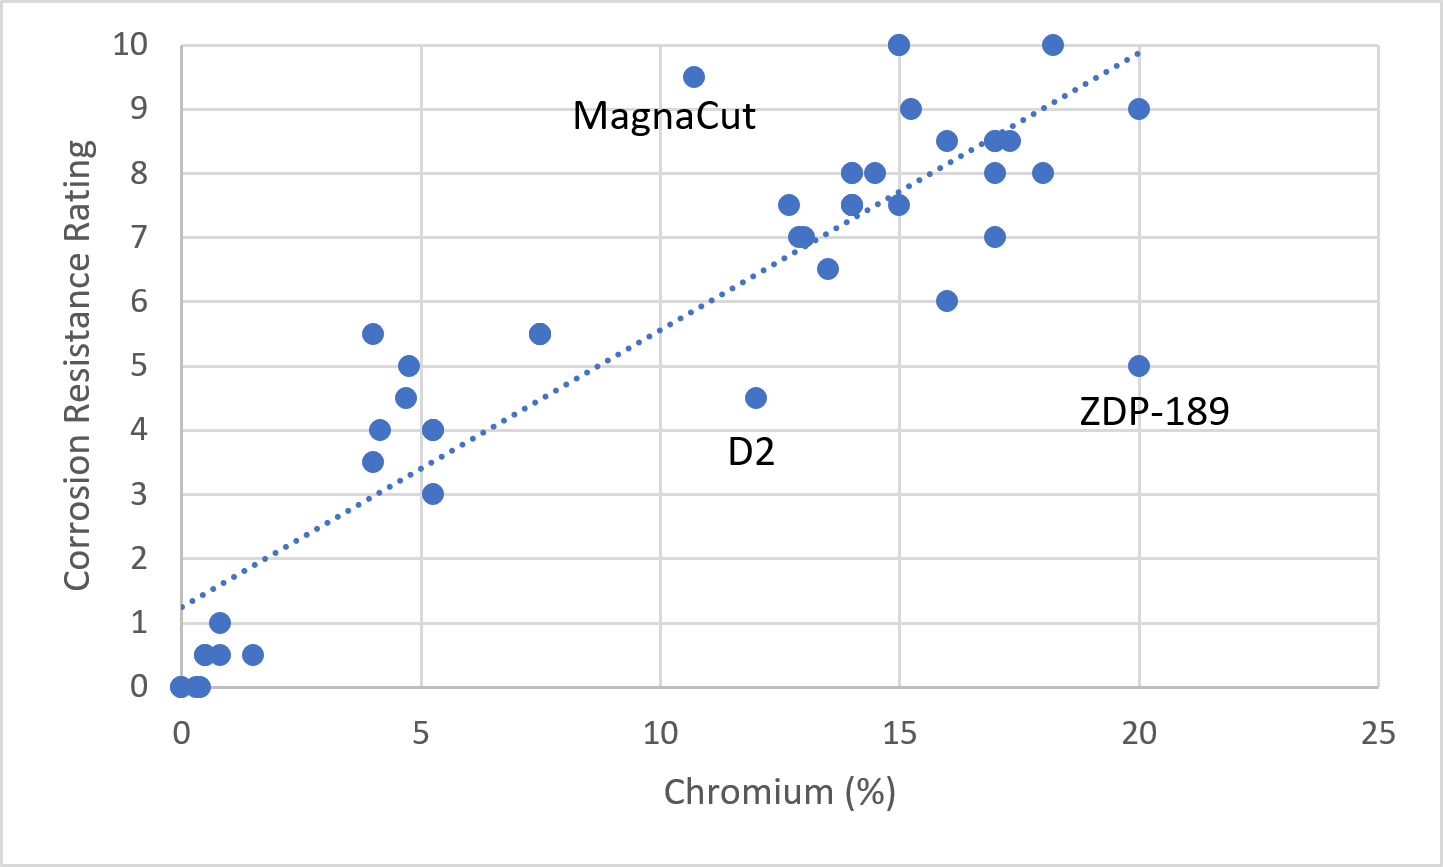
MagnaCut has high corrosion resistance for a given chromium content for two reasons: 1) all of the chromium is in solution rather than being locked up in a carbide, and 2) it has no chromium carbides in the heat treated condition and those carbides are bad for corrosion resistance. D2 and ZDP-189 have low corrosion resistance for their level of chromium. These steels have very high carbon and thus form a lot of chromium carbide, reducing the amount of chromium in solution available for creating the chromium oxide protective film at the surface. So I tried to plot Cr divided by carbon and see if that gave a better correlation, since D2 and ZDP-189 have a low Cr/C ratio:
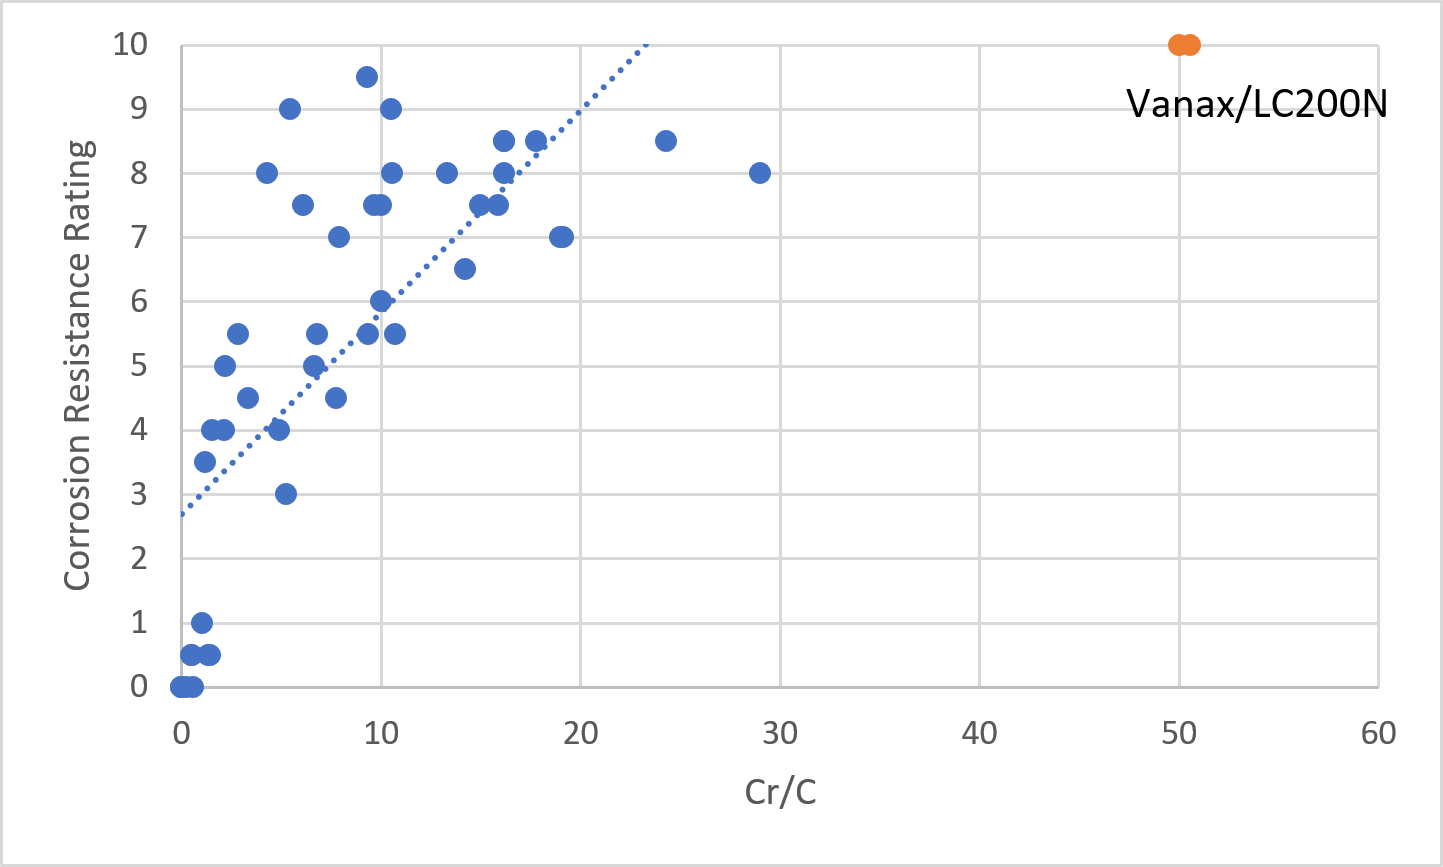
The trend now does not show those outliers that are too low but has a bunch of values that are above the trendline. Also Vanax and LC200N have a significant amount of carbon replaced by nitrogen so it is hard to plot them with the others. One reason there are many values that are above the trend line is because they have significant amounts of vanadium and thus much of that carbon is going toward the formation of vanadium carbides rather than chromium carbides. So I broke them out by whether the steels had sizeable vanadium additions:
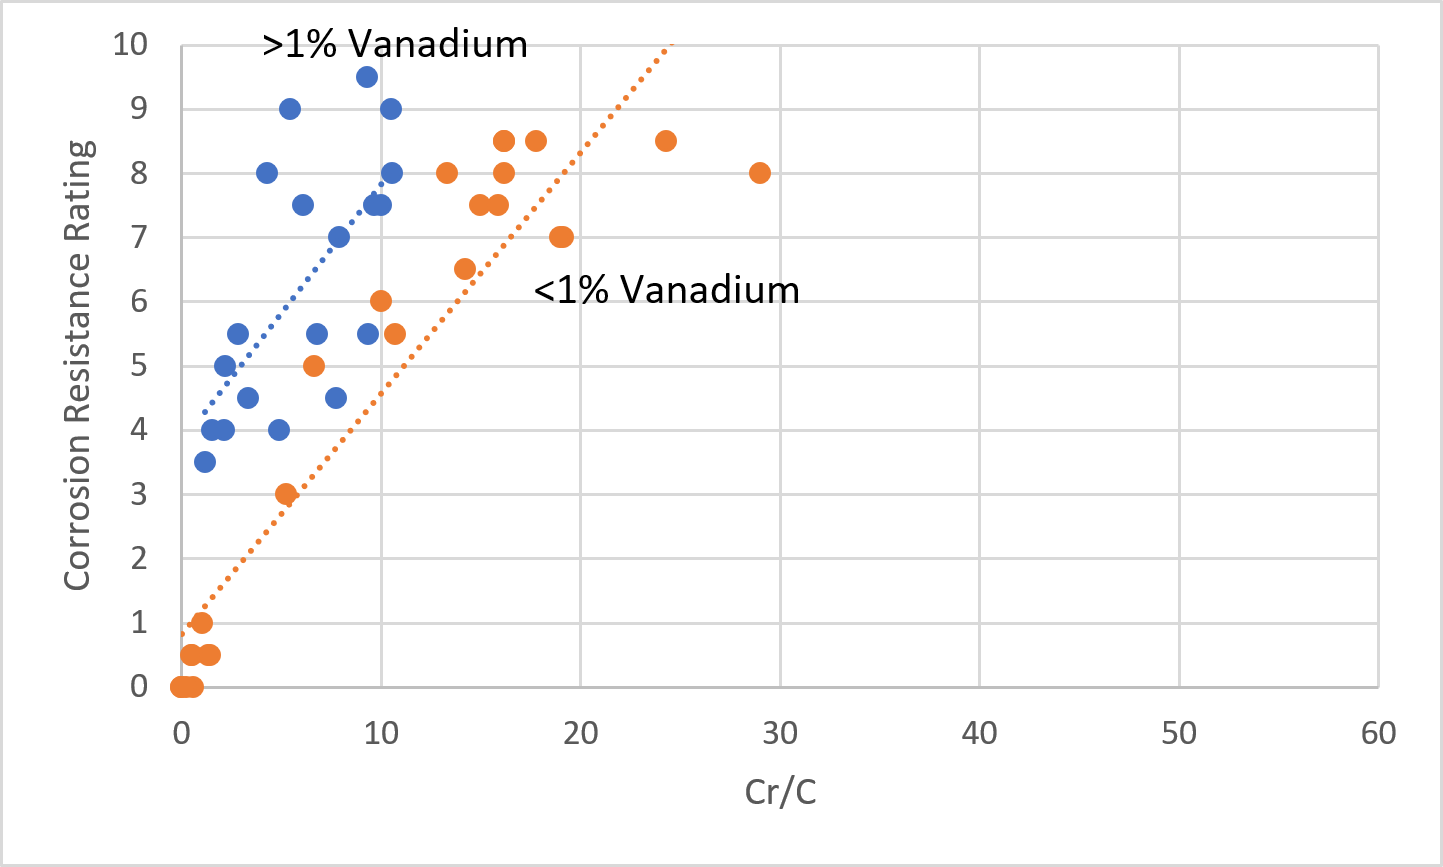
Definitely not getting perfect predictions but not terrible. You should be able to get a decent idea of the corrosion resistance by looking at the ratio of Cr over C from the bulk composition. Anything over a “7” or so would be stainless. One check of this chart would be an old steel called K190 which is a powder metallurgy version of an even older steel called D7, which is a non-stainless with 12.5% Cr and 4% V, which puts it into the high vanadium group. However, its Cr/C is still only 5.4 which would still predict it to be non-stainless. MagnaCut would be a 9.3 despite its relatively low Cr content so that still predicts it to be stainless, though that predicts it to be roughly an 8 out of 10 rather than its true 9.5. MagnaMax prediction is significantly worse even though its corrosion resistance is roughly the same, because it has much more carbon than MagnaCut, though with more V and Nb it still does not form chromium carbides. So as with all of the above estimates there are going to be outliers that do not work with the predictions.
Toughness-Edge Retention Balance
Of course you can see that our best correlations for both edge retention and toughness were with carbon. In other words, increasing carbon leads to an increase in edge retention but a reduction in toughness. And of course increasing one property leads to a reduction in the other. However, some things can improve the edge retention-toughness balance such as using vanadium alloying and powder metallurgy production.
Summary and Conclusions
So surprisingly you can get a decent estimate of knife steel properties including edge retention, toughness, and corrosion resistance just by looking at the carbon, chromium, and vanadium content. It was a fun exercise though I’m still not completely sure how much utility it has. Of course this isn’t perfect and there are so many hundreds of caveats to this estimate that you can’t take any estimate like this as gospel. But hopefully it will lead to fewer people believing that “steel X has crazy high edge retention!!!” because they can check the carbon content and know right away that their claim is questionable.

Is this the first publication of Magnamax’s recipe? Quite the sneaky reveal.
Exzellent
I share your enthusiasm for this sort of graphical analysis. It’s always cool to see raw data come together and and show something, even if it’s just confirming what you expected. Do you use anything beyond Excel to experiment with different curve fits? I’ve always felt like I was acting a bit oddly using it for this sort of thing but I never came across anything any better for playing around with data and making these sort of graphs.