Thanks to Fingal Ferguson for becoming a Knife Steel Nerds Patreon supporter!
CATRA Edge Retention Testing
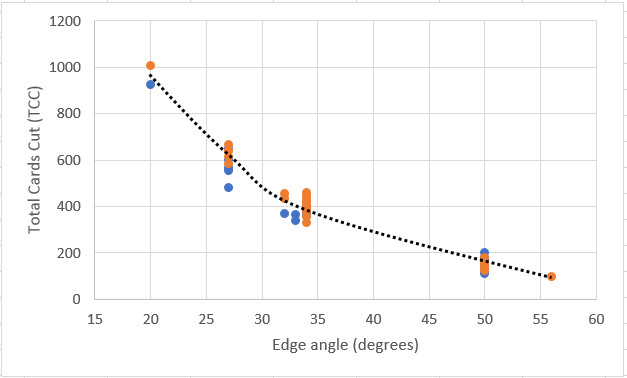
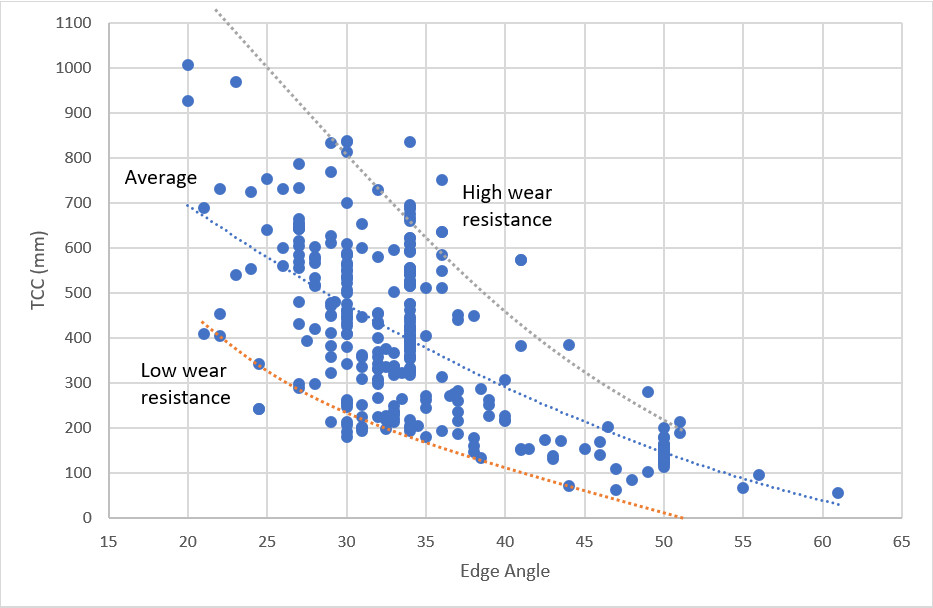
I previously wrote articles about CATRA testing of edges. The CATRA test uses 5% silica-impregnated cardstock which it slices with a fixed stroke length and force. The first article primarily looked at the effect of edge angle on edge retention; specifically, that edge angle greatly controls edge retention:
The second article looked at the effect of steel hardness, carbide volume, and carbide type. Carbides are hard particles that contribute to wear resistance and therefore to slicing edge retention. More carbide means better edge retention and harder carbides means better edge retention. Harder steel also resists wear better and therefore lasts longer in a slicing edge retention test. Based on those results, an equation was developed to predict CATRA edge retention based on steel hardness, and carbide volume of each type.
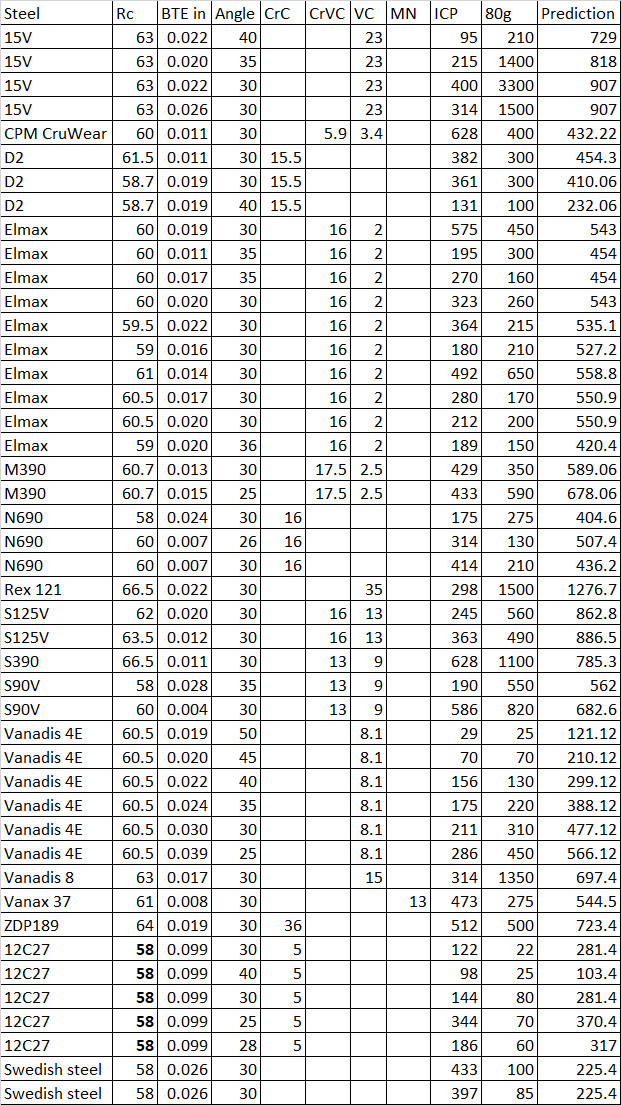
TCC (mm) = -157 + 15.8*Hardness (Rc) – 17.8*EdgeAngle(°) + 5.0*Fe3C(%) + 11.2*CrC(%) + 14.6*CrVC(%) + 26.2*MC(%) + 9.5*M6C(%) + 20.9*MN(%) + 19.4*CrN(%)
Therefore, if you know the carbide volume of the steel, steel hardness, and edge angle you can get a very good estimate of the CATRA edge retention of a knife. I provided tables of carbide information for many knife steels, which you can find from “the second article” link given above, and a few more at the end of the third article. So S90V steel with its 13% vanadium-enriched chromium carbides (CrVC) and 9% vanadium carbides (VC) at 62 Rc and an edge angle of 30°, CATRA edge retention of 714 mm is predicted. A 420HC steel at 56 Rc with 3% chromium carbide (CrC) at the same angle of 30° is predicted to only get 227 mm.
The third article also pointed out many potential deficiencies in the CATRA test, such as the fact that in “real” cutting there is likely more stress on the edge, especially lateral forces. This means that in rope cutting there may be effects of microchipping that are not seen in the CATRA test. Another point brought up by critics of the CATRA test is that the silica-impregnated cardstock is not representative of real materials that might be cut with a knife. Based on these kinds of questions I wanted to find out if the CATRA test is actually a useful prediction of slicing edge retention, or if it is just a controlled, scientific test that measures one specific thing but has little applicability when it comes to predicting knife performance, even when limited to slicing edge retention.
The Comparisons
The best way to test the CATRA test would be to test a range of knives with CATRA and then to test the same knives with rope cutting. And maybe eventually we will be able to do a study like that. For now, I am utilizing three datasets with many rope cutting tests and then comparing them with the predicted CATRA edge retention. The three datasets are:
- The Cedric and Ada Youtube channel – https://docs.google.com/spreadsheets/d/1b_rNfdJnL9oyn-JoL9yUHhUmDLAP1hJ1dN_0q5G4tug/edit#gid=1607644856
- Jim Ankerson reports on BladeForums – https://www.bladeforums.com/threads/ranking-of-steels-in-categories-based-on-edge-retention-cutting-5-8-rope.793481/
- Pavol Šandor on Youtube – https://drive.google.com/drive/folders/0B7TfQWLkUv9sVVNTWWJqSndWaGs
Pete of the Cedric and Ada channel cuts 10mm sisal rope, Grunt brand, using what he describes as a “slicing pushcut” until the knife no longer slices paper. This is an interesting one as the pushcutting element may change the results somewhat vs the more pure slicing of the CATRA test. You can see his cutting motion as well as answers to other questions in this video. I utilized only the tests that were done with knives sharpened to the same angle on the Worksharp as comparing factory edges is one extra variable too many for me to deal with. The thickness behind the edge and the hardness of each knife is not reported which are important variables I cannot compare.
Jim Ankerson tests knives by slicing 5/8″ manilla rope. He cuts on a scale to see the force required to complete each cut, and stops when the scale reaches 20 lbs; each knife starts out in the 14-15 lb range. Jim has a range of steels ranked in different categories based on knives polished to 6000 grit on an Edge Pro at 30 degrees inclusive. He then has a second larger dataset with the same edge angle but sharpened with a 400 grit silicon carbide stone. The larger dataset includes hardness and thickness behind the edge for many of the tests, so I only analyzed results that included those values.
Pavol Šandor cut 20mm rope by hand in earlier tests and with a fixed weight in more recent tests. He uses a slicing motion, and records the number of cuts to reach different levels of cutting ability, including the point where the knife requires no longer slices through 12 g/m2 paper, and then 80 g/m2 paper. And the point where the knife can no longer cut through 10mm of rope in one slice with 50N applied, and with 70N applied. I used the 80 g/m2 slice paper data for my analysis as that is the point that took the most cuts to reach.
For both datasets I only looked at steels for which I have experimentally-reported carbide volume information. Based on heat treatment the carbide volume information may be slightly different but they are the best numbers we have.
Ankerson Comparison
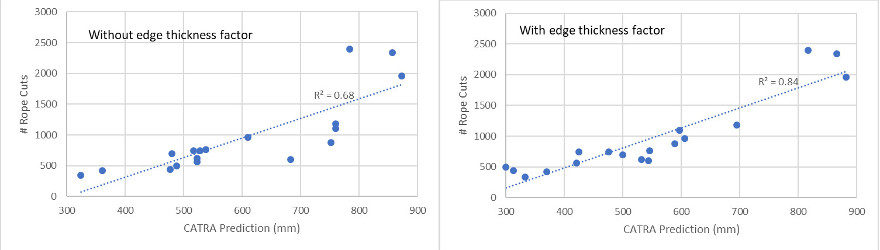
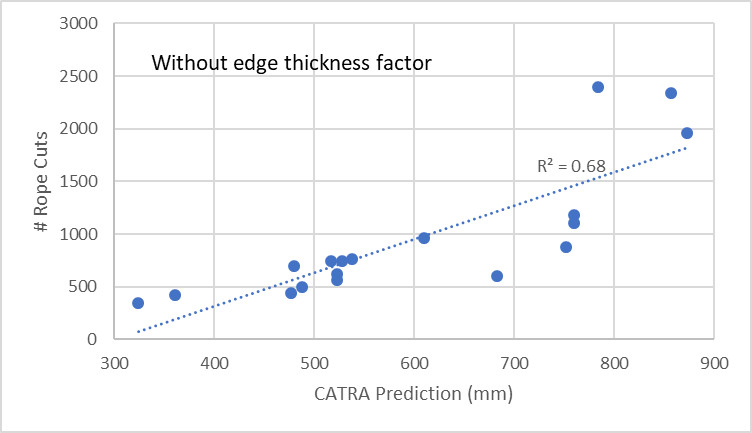
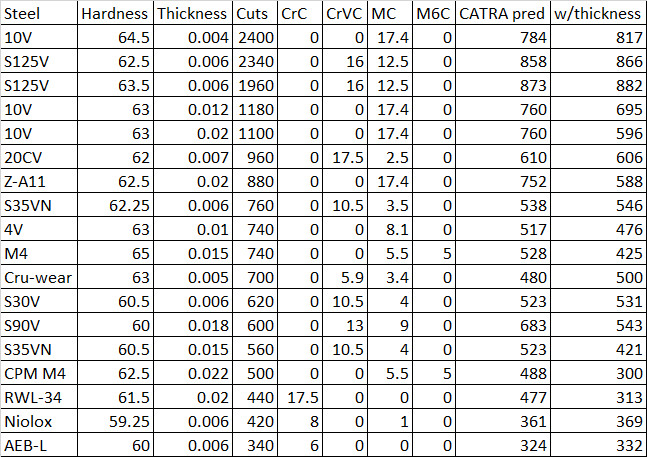
I will start with the Ankerson dataset because it is smaller and includes hardness and thickness behind the edge. There is a good range of steel tested from the relatively low wear resistance AEB-L to the high wear resistance 10V and S125V. My equation does not include a factor for thickness behind the edge, as that information was not available in the CATRA dataset. When comparing the CATRA prediction with Jim’s results, the correlation is good. The CATRA numbers are not the same as the number of cuts, of course, as one is a prediction of a CATRA result in mm and the other is number of cuts made in a rope. The R2 value is 0.68, where 1.0 is perfect and 0 is no correlation. The trend looks convincing, as shown below. One discrepancy is the difference between the lowest and highest edge retention knives. The CATRA prediction shows the best edge retention knife as being 2.7x better than the worst, while Jim’s data shows it is 7.1x. I don’t know if this is simply a difference in the “slope” between the two tests or if it is some kind of real effect where the two tests are measuring somewhat different things.
We know that thickness behind the edge has a significant effect on cutting ability, and there is a pretty significant range of edge thickness in the data, from 0.004-0.022″. The edge thickness had a particularly large effect with high wear resistance steels 10V and S125. The difference in edge retention between medium and high wear resistance steels increased with thinner geometry:
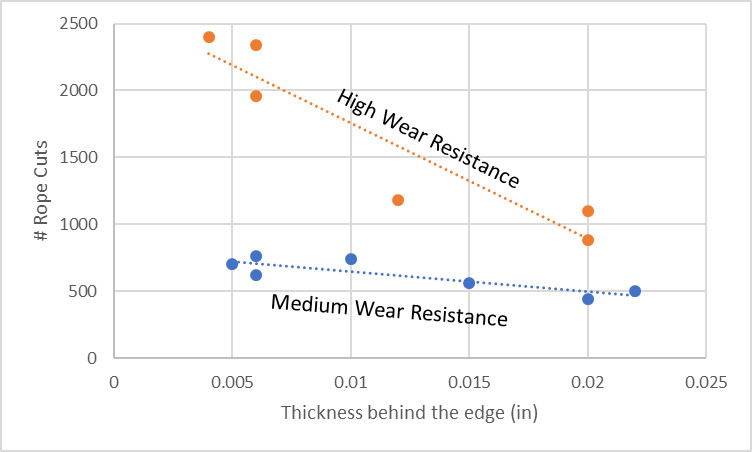
This effect is similar to that seen with edge angle in the CATRA data, where the difference between low and high wear resistance steels was greatest with very acute edges:
When adding an edge thickness component to the CATRA equation, -12300*thickness(in), the correlation between CATRA and the rope cutting data is significantly better, increasing to 0.84:
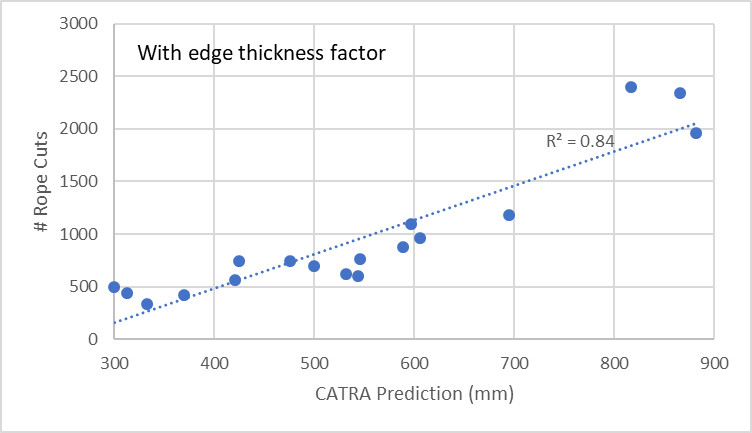
This is probably about as good a correlation as we could expect, in my opinion, given the inherent scatter in testing.
Cedric and Ada
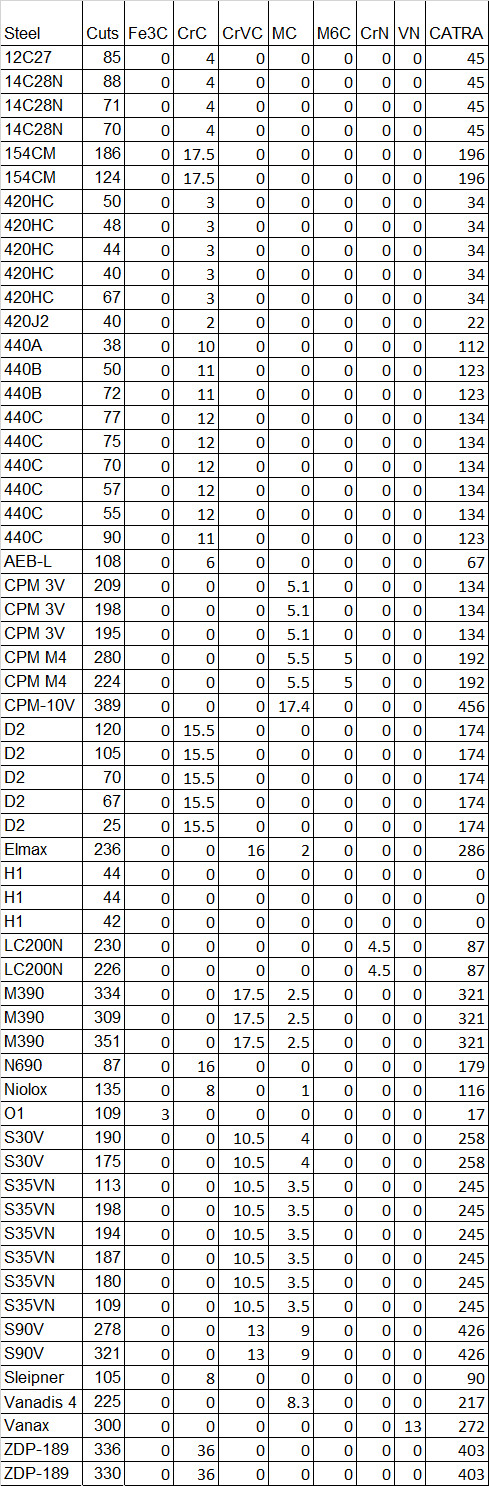
As previously mentioned, thickness behind the edge and knife hardness is not available from Pete’s dataset. That inherently reduces the prediction power of the CATRA equation. Plus there are many more knives included. There is some significant scatter that cannot be accounted for with the CATRA equation; for example, D2 knives range from 25 cuts to 120 cuts. That large range may be due to heat treatment, thickness behind the edge, or even misinformation on steel type. On the plot I have “CATRA carbide contribution” as only the carbide part of the CATRA prediction equation was used. Regardless, let’s see how well the prediction does:
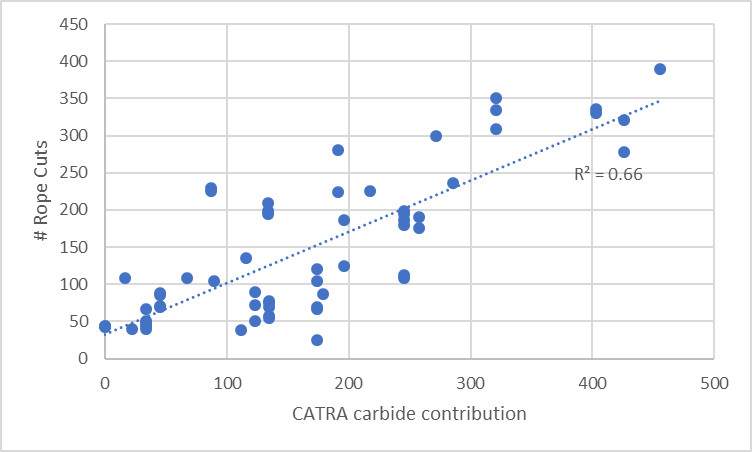
It turns out the prediction does quite well, with an R2 value of 0.66, very close to the value for the Ankerson dataset without an edge thickness term. The range of values are more similar here than in the Ankerson dataset; the difference between the best and worst knife is close to the same. This is very impressive given the important variables that are missing. There is some scatter, of course, with some knives doing better or worse than expected, such as the 25 cut D2 result.
Steels that did better than expected based on the CATRA prediction include LC200N and CPM-M4. I don’t have a good explanation for the good performance of LC200N, which made about 230 cuts vs its predicted position at about 100 cuts. The steel does not have a high volume of carbides or nitrides, and even if it was assumed that all of the hard particles were the very hard vanadium carbide the steel wouldn’t perform as well as tested. The identical Cronidur 30 was in the CATRA dataset and it did well but not to the same level as found in Pete’s testing. Perhaps the edges were thin relative to the other knives. CPM-M4 is often heat treated to relatively high hardness, greater than 62 Rc, which may explain one knife reached 280 cuts vs the predicted of about 180.
Pavol Šandor
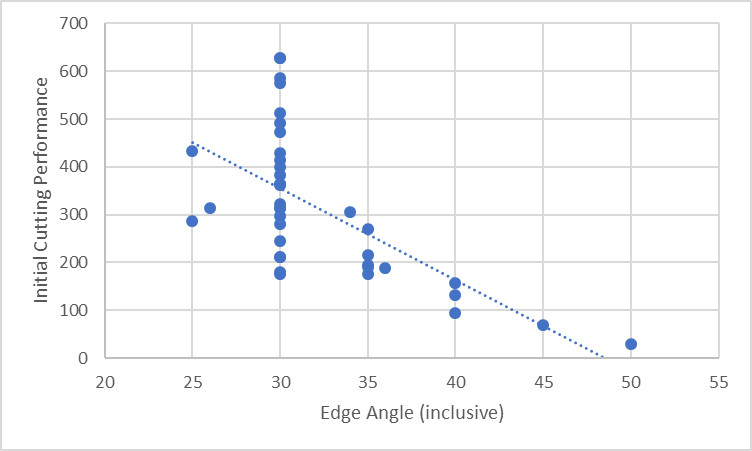
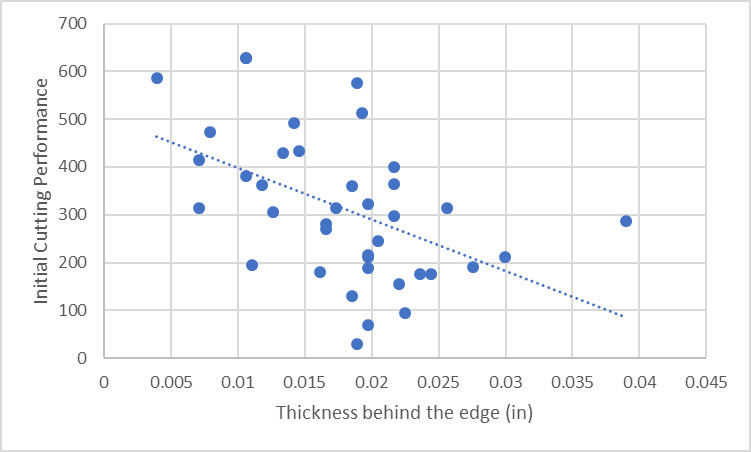
Pavol recorded a lot of information with each of his tests, including hardness, thickness behind the edge, and edge angle. Pavol also measured “initial cutting performance” which is the amount of rope that was cut in the first stroke, and that correlated well with both thickness behind the edge and edge angle:
However, when edge angle and thickness behind the edge is plotted against total edge retention, only edge angle affected edge retention:
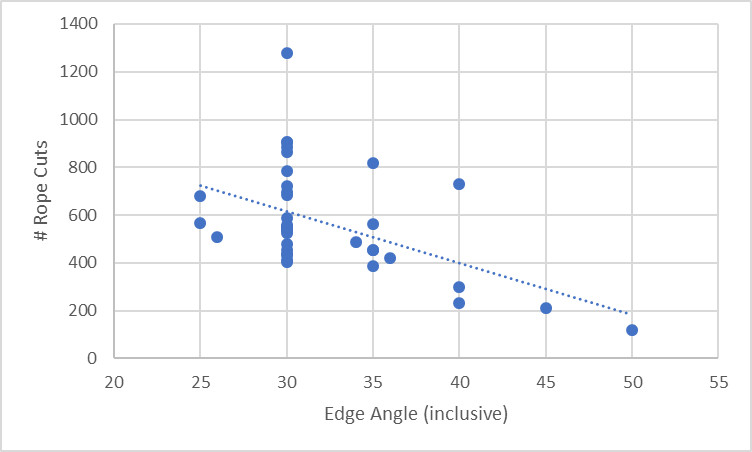
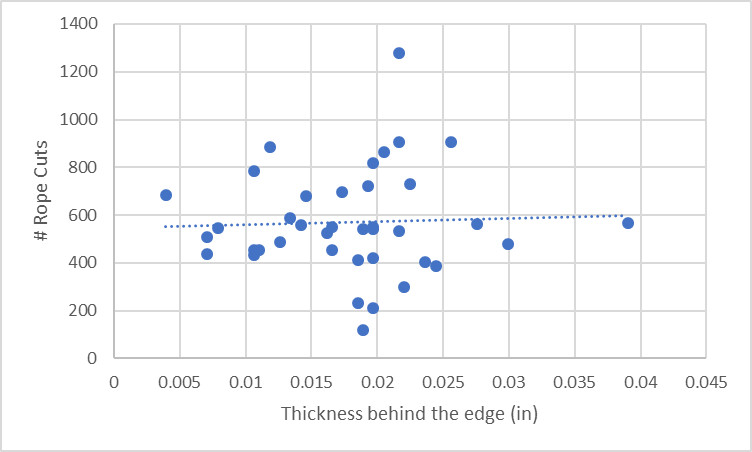
It is surprising that there was no correlation between edge retention and thickness behind the edge. I don’t have any good explanation for why this behavior was so different than that recorded by Jim Ankerson. But it is an interesting difference to point out. Perhaps Pavol or Jim have ideas based on being closer to the testing than me.
When the CATRA prediction is plotted vs the measured rope cutting edge retention there is a decent correlation with R2 of 0.5:
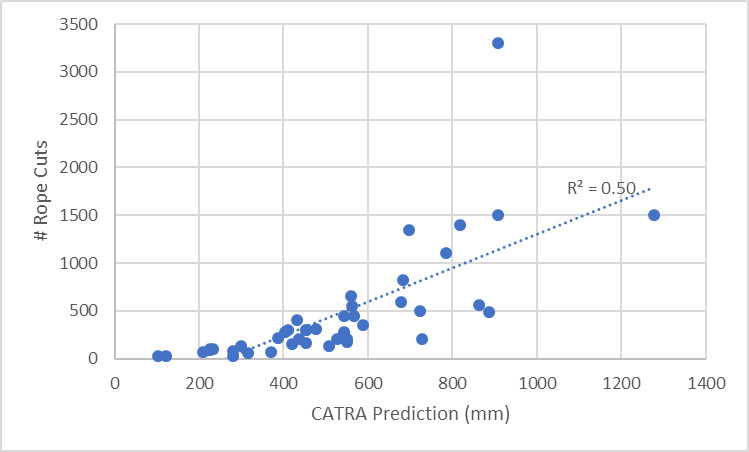
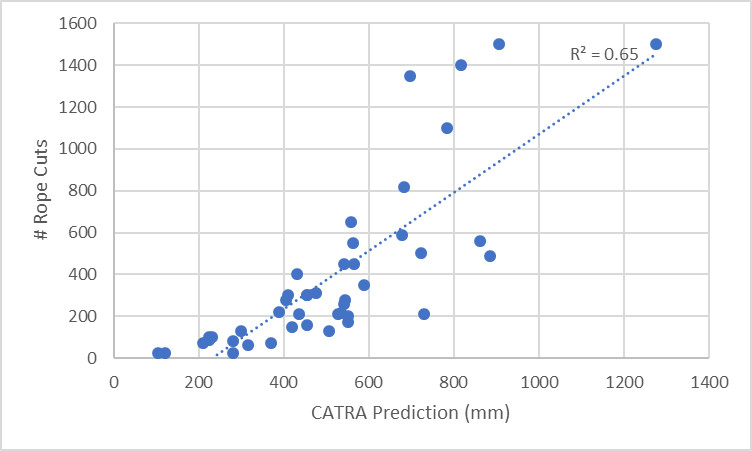
There is one potentially outlier value of 3300 cuts with a 15V knives. That number of cuts is much higher than everything else, even another test with a 15V knife of similar geometry from the same maker with the same hardness. If that value is removed the R2 improves to 0.65, similar to the other two datasets:
Summary and Conclusions
Overall I am very pleased with the correlation between CATRA and rope cutting. This despite missing variables, and the use of a “slicing pushcut” by Pete which is somewhat different than the cutting motion of CATRA. And in all cases these are knives produced by many different factories and knifemakers which introduce other factors into the test I am likely not accounting for. Better would be to use knives that are all produced in the same way to compare the effects of steel, hardness, and heat treatment. However, even with these limitations CATRA results look very similar to rope cutting by people. Therefore, CATRA looks to be a good test for slicing edge retention. The rope cutting dataset from Jim Ankerson showed that thickness behind the edge is important to cutting ability and edge retention, in a similar way to edge angle. In other words, edge geometry is extremely important to cutting ability and edge retention. Pavol’s dataset also showed a significant effect of edge thickness on cutting ability but not on edge retention. His testing also confirmed that reducing the edge angle greatly improves edge retention, as was shown in CATRA testing. I hope in the future to do a more controlled comparison between CATRA and rope cutting tests where we may learn more about the differences.
Full Data Tables
Jim Ankerson Table
Cedric and Ada Table
Pavol Šandor
Correlation Between Different Rope Cutting Tests
I was asked if the different rope cutting tests correlate well with each other. I made a table lining up the steels that are the same between the three different datasets. I grouped some steels together, for example, Vanadis 4E and 4V were considered the same, 20CV and M390 were the same, RWL-34 and 154CM, etc.
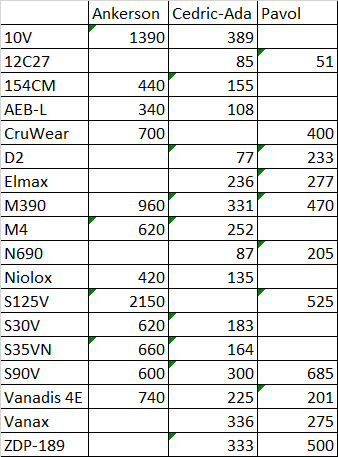
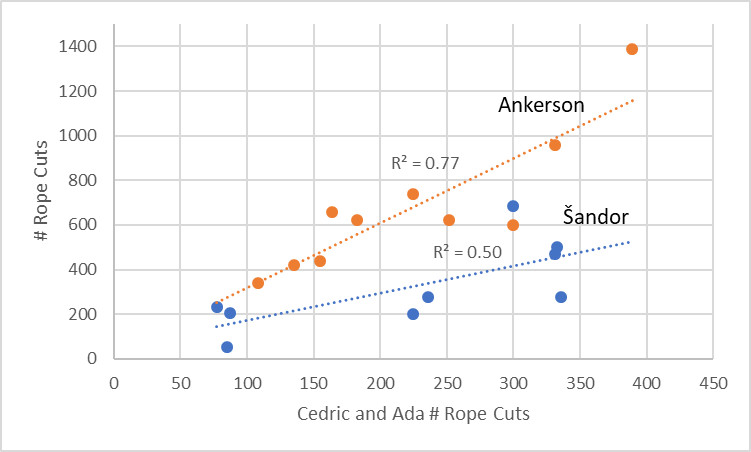
Even without compensating for sharpening method, edge angle, hardness, or edge thickness, the correlation between them is pretty good:
This is awesome! Looks like it took a ton of work to do. I would like to see how Cliff Stamps numbers look also. Also, how do you account for edge finish? If I recall Jim Ankerson did toothy edges and polished edges. Maybe edge finish is the reason Pavols numbers don’t match up as much. Again, nice work!
Thanks Jason. You make a good point about edge finish, I don’t have a way to account for that. In the 154CM CATRA study there was not much effect of edge finish: https://knifesteelnerds.com/2018/06/18/maximizing-edge-retention/ However, those that perform rope cutting tests have found a big effect of edge finish, which means either rope cutting behaves somewhat differently or something else was going on in the 154CM CATRA study. What is the best collection of Cliff Stamp results to look at?
Sorry Larrin, I didn’t see your reply sooner. Here is the numbers I was talking about that Cliff Stamp did:
http://www.cliffstamp.com/knives/reviews/cardboard.html
I’ve done a fair amount of testing using the Cedric & Ada method and haven’t published it yet. I’m not seeing a lot of difference in edge retention with different edge finishes, with a couple of exceptions. The first is that stropping seems to improve fine edges a little. And the other is that very course edges do worse.
It’s hard to give a grit comparison because stones are so different. One 600 grit stone will give a very different edge than another 600 grit stone. So testing needs to be done across multiple knives with multiple grits on the same stones.
Using diamond matrix stones I’m generally seeing that edge retention drops off a lot below 600 grit/35 micron stone. 1100 grit/17 micron is better then the 600, but it generally flattens out after the 1100. Some knives do a little better with higher grits, some do a little worse. This could just be testing or sharpening differences.
As I do more testing I’ll get some curves published. For most steels on this stones, 1100 grit seems to be the best effort/performance point. Even if you get more with 2000 or 4000, it’s not much more. And I’m sure there are exceptions for some steels (cast 440C for example).
I’m looking forward to your results!
Excellent work here, Larrin. Thanks for taking the time and publishing.
David R
The work of RuslanKiyasov on youtube will also be useful.
Here is his rope cutting results table. He tends to stress the importance of blade shape and edge thickness when drawing conclusions from the results: kiyasov.com/youtube/results/
The last 3 columns go: total cuts, length of edge, cuts/length
Hello Larrin, love your work very much.
In regards to the thickness behind the edge and the difference between Ankerson and Pete, could be the selected method for stopping the test, since cutting performance is increased with a thinner grind, on Ankerson’s 20lb on a scale method less force has to be applied at the same apex width. Meanwhile Pete’s stopping point is simply measuring the Keeness of the apex itself.
By the way, your book is on its way for Christmas,
Merry Christmas
Mateo
I agree that is a likely explanation.
Well Dr. Thomas in my experience I can agree with you pretty closely. Something of note, wood carvers and leather workers take their edges to a mirror finish as I’m sure you’re aware. Those materials are tough to cut. I’m guessing on a dice cut of rope a mirror finish would do better than a toothy finish, but if slicing the rope the winner would be a toothy finish I’m sure. I know slicing a tomato is easier with a knife sharpened on my 800 grit stone than a mirror polish is.
For leather I use a 15 degree edge or less depending on the tool. All my razor knives get stropped on one micron diamond paste in leather at less than ten degrees, some get stropped on mahogany with the paste in it. I made a 2/3 round knife out of .092 D2 at HRC 62, usually for knives I take D2 down to 60 and yes the edge is thin. Has to be to drag it through leather.
So anyway it seems that cutting rope the way they do with varying methods I’m surprised at the good correlation. There is one edge finish you might try, a hand honed edge by someone who is very good at it. I say this simply because I’ve noticed my hand finished knives’ edges last a little longer than a straight honed edge when I use a fixture. All I can see is that no matter how good a hand sharpener one may be the cutting edge becomes convex. I notice mine are and I naturally sharpen at 17 degrees, but am not perfect over the course of re-profiling an edge. The cutting bevel is slightly convex and I’ve been hand sharpening knives for some time.
Just some observations.
Larrin, at some point time and cost willing it would be interesting to see a comparative test of a select couple of steels such as AEBL and M390 (as an example) where the point is not to just match angles and thickness and see how they fair, because this is ignoring one of the great purposes of heat treat and steel to attain the best geometry for a knife. factoring in work such as Roman Landes, to me a real world relevant catra test is to take each steel to its optimal thinness where it wont fail the test and check edge retention.
As you can see on my recent videos, im demonstrating cutting through rib bones with no damage using a 56Rc victorinox paring knife thats only 6-7dps.
as a knife user, i want steels only for how thin they can go for optimal cutting in most cases. so if AEBL as an example can perform at 7dps without fail and match or exceed M390 when both are reduced to their best cross sections capable on the edges and thicknesses, then AEBL is the real world winner as its easier to maintain, for a better cut.
just a thought
what is your channel ,kyley